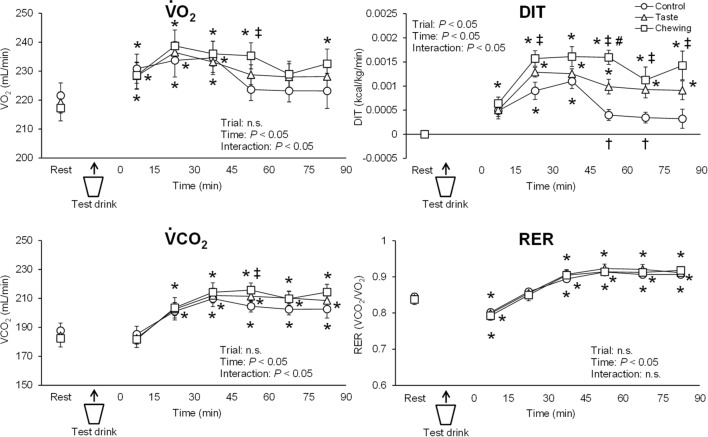
Figure 2.
Time courses of changes in gas-exchange variables and diet-induced thermogenesis (DIT) in the control, taste, and chewing trials. Circles, triangles, and squares denote data from the control, taste, and chewing trials, respectively. ·VO2 oxygen uptake, DIT diet-induced thermogenesis, ·VCO2 carbon dioxide output, RER respiratory exchange ratio. *P < 0.05, vs. resting baseline in each trial. †P < 0.05, difference between control and taste trials. ‡P < 0.05, difference between control and chewing trials. #P < 0.05, difference between taste and chewing trials.

