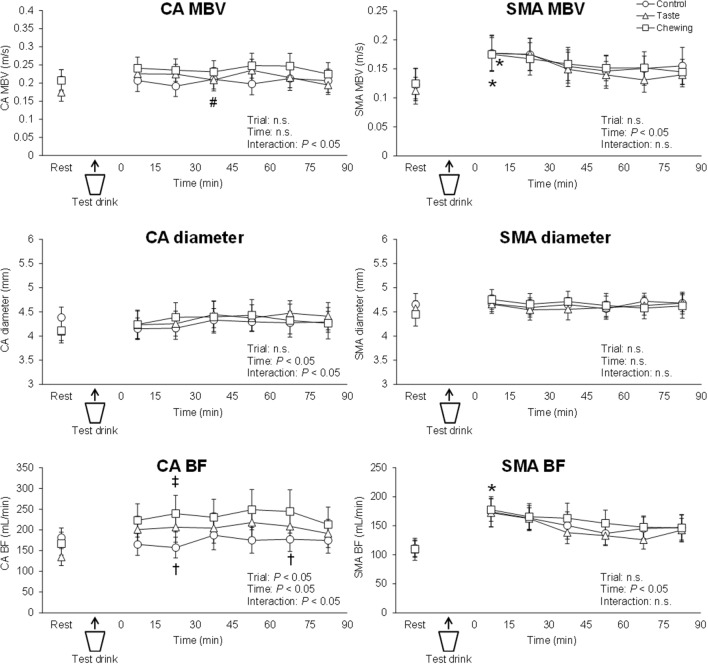
Figure 4.
Time courses of changes in splanchnic circulation in the control, taste, and chewing trials. Circles, triangles, and squares denote data from the control, taste, and chewing trials, respectively. CA celiac artery, SMA superior mesenteric artery, MBV mean blood velocity, BF blood flow. *P < 0.05, vs. resting baseline in each trial. †P < 0.05, difference between control and taste trials. ‡P < 0.05, difference between control and chewing trials. #P < 0.05, difference between taste and chewing trials.

