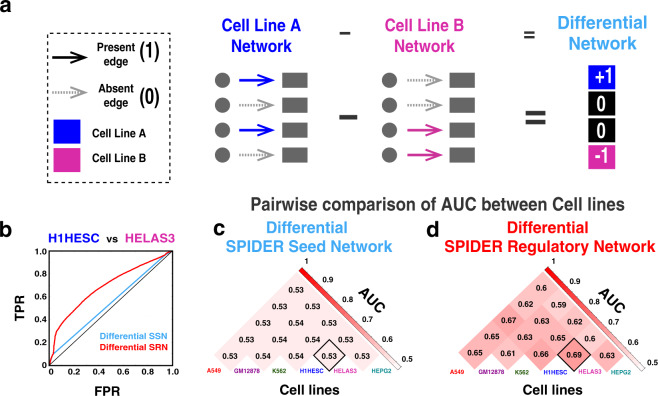
Fig. 3. Cell-specific interactions predicted by SPIDER.
a Illustration of our approach to assessing cell-line-specific network relationships through differential network analysis. b ROC curve showing the evaluation of the differential networks that were calculated by comparing the H1HESC and HELAS3 SPIDER seed networks (blue) and regulatory networks (red). c AUC values of each of the pairwise comparisons of the SPIDER seed networks. d AUC values of each of the pairwise comparisons of the SPIDER regulatory networks.

