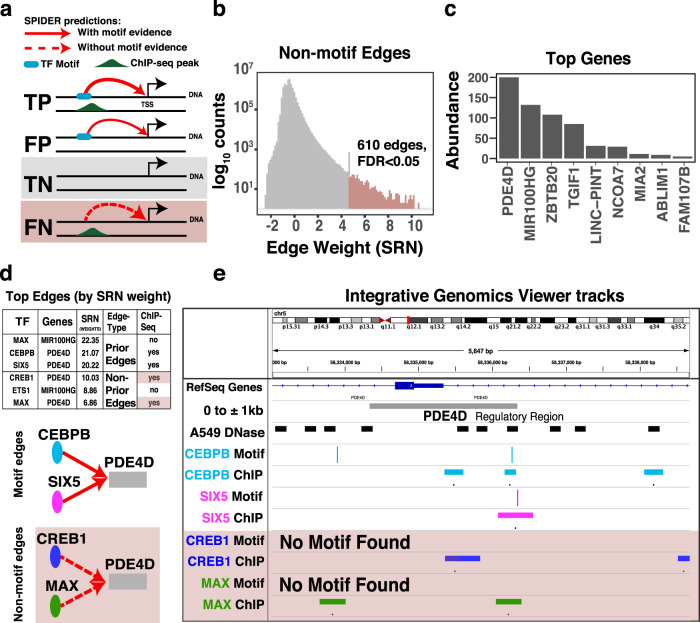
Fig. 6. SPIDER Identification of hidden regulatory relationships.
a Schematic showing the relationship between true positives (TP), false positives (FP), true negatives (TN), and false negatives (FN) in the SPIDER seed network, as well as potential SPIDER predictions (red lines). b Distribution of the SPIDER-predicted edge weights in the A549 network for the subset of edges that were absent in the A549 SPIDER seed network (TN or FN edges; see panel a). Of these, top-weight edges that have a significant (FDR < 0.05) weight in the SPIDER-predicted networks are shown in light red. c The number of times a gene is targeted by one of the top-weight edges shown in panel b. d A table showing the three top-weight edges predicted by SPIDER that originate from transcription factors with ChIP-seq data. Edges validated by ChIP-seq are illustrated below the table. e Integrative Genomics Viewer tracks showing DNase hypersensitivity regions, motif predictions, and ChIP-seq data in the PDE4D promoter region. Motif, DNase, and ChIP-seq peaks exist for CEBPB and SIX5. However, although only DNase and ChIP-seq peaks can be seen for CREB1 and MAX (but no corresponding motif), SPIDER recovered these regulatory relationships. See also Supplemental Table 5 and Supplemental Table 6.

