Figure 4.
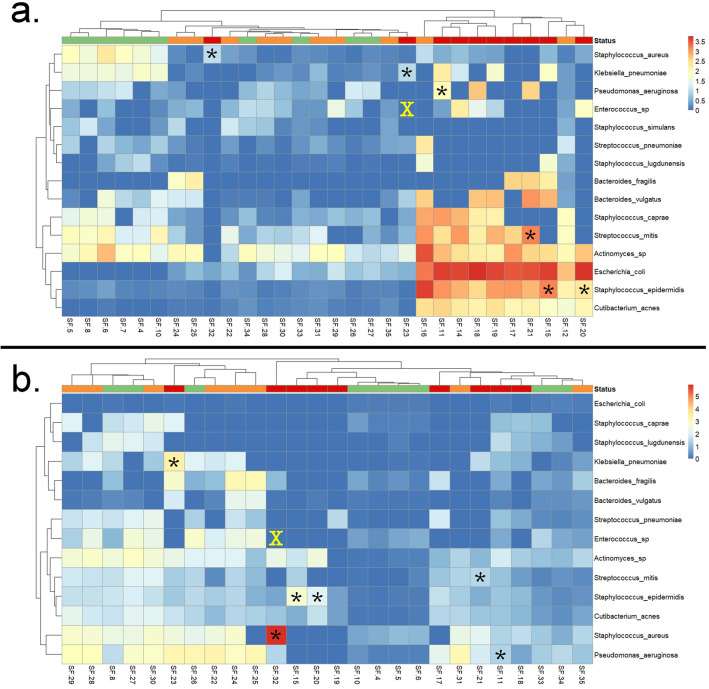
Heatmap of 15 observed clinically relevant PJI-associated pathogens. Samples by group are depicted above the heatmap, with the following colors: orange (aseptic joints), red (infected joints), and green (primary joints). Heatmap of PJI-associated pathogens observed in metatranscriptomic [MT] (a) and metagenomic [MG] (b) synovial fluid samples. Boxes represent CPM-r normalized counts of each pathogen within synovial fluid samples. Stars (*) represent pathogens identified by library preparation and culture-based methods while an X indicates that the pathogen was identified by culture but not sequencing. Infected synovial fluid samples from the MT dataset yielded differential clustering from remaining samples, with only one infected sample (SF-32), plotting distinctly from other infected samples (a). Heatmaps were generated using pheatmap version 1.0.12 (https://cran.r-project.org/web/packages/pheatmap/pheatmap.pdf) and ggplot2 version 3.3.5 (https://cran.r-project.org/web/packages/ggplot2/ggplot2.pdf) within R 3.6.1 (https://www.R-project.org/). Parts of the heatmap marked with stars (*) and X were added using Adobe Photoshop version 21 (https://www.adobe.com/products/photoshop).

