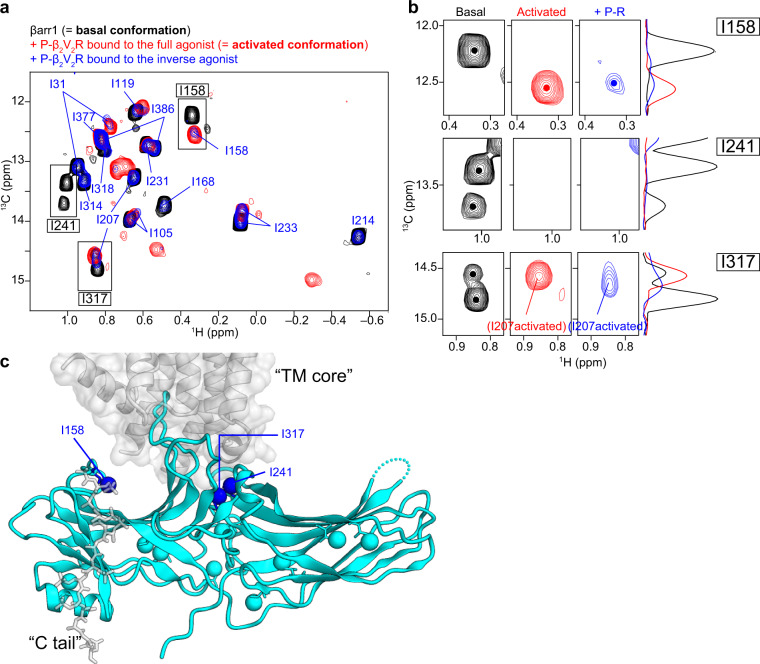
Fig. 3. Conformational change of βarr1 upon binding to phosphorylated β2V2R bound to the inverse agonist.
a Overlay of the 1H-13C HMQC spectra of [u-2H, Ileδ1-13C1H3] βarr1 in the basal state (black), the complex with phosphorylated β2V2R in rHDLs bound to the full agonist (red), and the complex with phosphorylated β2V2R in rHDLs bound to the inverse agonist (blue). b Magnified views of resonances from I158 (upper row), I241 (middle row), and I317 (lower row) in the basal conformation (black), the activated conformation (red), and in the complex with phosphorylated β2V2R bound to the inverse agonist (blue). The 13C 1D projections of selected regions are shown on the right of the spectra. The resonance from I158 exhibited a chemical shift change, and the resonances from I241 and I317 disappeared upon the addition of phosphorylated β2V2R in rHDLs bound to the inverse agonist. The split of the resonances from I241 and I317 in the basal state indicated the local conformational exchange, which is distinct from the exchange between the basal and activated conformations. c Mapping of the methyl groups adopting the activated conformation, in the complex of phosphorylated β2V2R bound to the inverse agonist, on the structure of βarr1 in complex with β1AR-V2R6P and Fab30 (PDB ID: 6TKO). Methyl groups exhibiting chemical shift changes or signal disappearance upon binding to phosphorylated β2V2R in rHDLs bound to the inverse agonist are indicated.

