
Fig. 2. Histogram of the 1980–2019 frequency distribution of low flow days and corresponding WHI values.
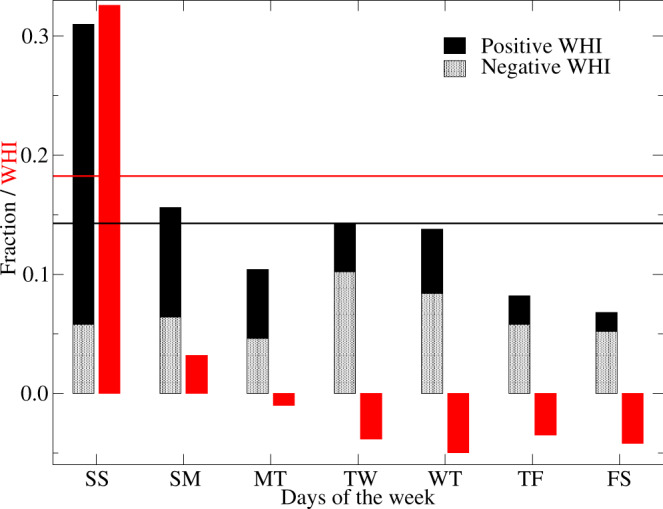
Black bars denote the two consecutive days with low flows while red bars represent the WHI values for 500 sites across the USA and Canada, 1980–2019. Fractions of the two consecutive days with low flows are partitioned according to positive (solid) and negative (dotted) WHI values. The days of the week begin with the Saturday/Sunday (SS) combination and end with the Friday/Saturday (FS) combination. The horizontal black line denotes the expected value if the two-day low flows were distributed randomly while the horizontal red line marks the mean WHI across the 500 sites.