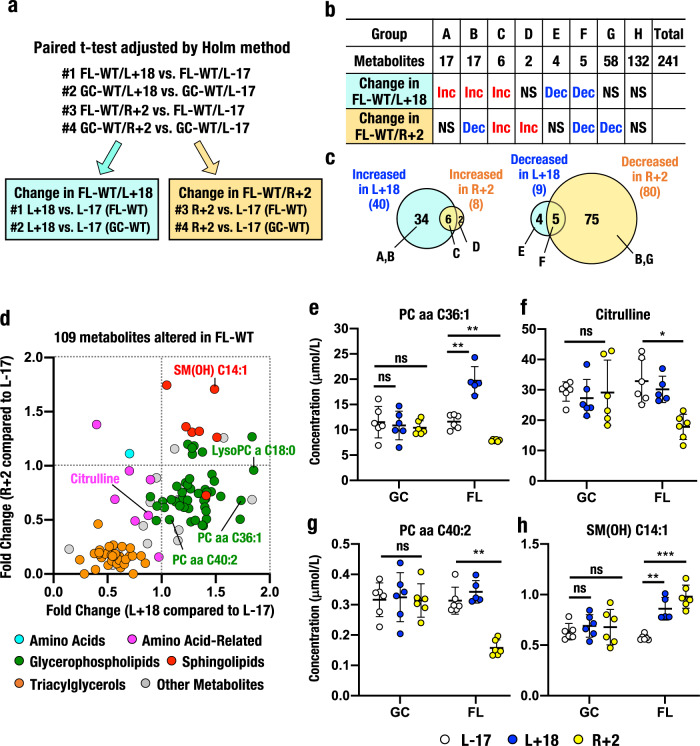
Fig. 3. Metabolic responses observed in WT mice during and after spaceflight.
a Statistical analyses to identify altered metabolites in FL-WT mice. Paired t-tests were performed between time points (L+18 vs. L-17, #1 for FL-WT and #2 for GC-WT; R+2 vs. L-17, #3 for FL-WT and #4 for GC-WT), and P values were adjusted using the Holm method. Altered metabolites were determined based on an adjusted P < 0.05 and combinations of comparisons (#1 and #2 for L+18, blue box; #3 and #4 for R+2, yellow box). b Numbers of increased (Inc) or decreased (Dec) metabolites during (change in FL-WT/L+18) and after (change in FL-WT/R+2) spaceflight. c Venn diagram of increased (left) or decreased (right) metabolites selected through a combination of statistical analyses. d Relationship between fold changes (FC) observed at L+18 compared to L-17 and R+2 compared to L-17 in FL-WT mice. The plot shows 109 metabolites whose levels were altered in FL-WT mice at L+18 (horizontal axis) and R+2 (vertical axis). Note the marked clusters of changes in metabolites in this plot. e–h Representative metabolites whose levels were altered during and after spaceflight (FL) compared with GC. One significantly altered metabolite at FL L+18 is PC aa C36:1 (e), two significantly altered metabolites at FL R+2 are citrulline (f) and PC aa C40:2 (g), and one significantly altered metabolite at both FL L+18 and R+2 is SM(OH) C14:1 (h). The results are presented as the mean plasma concentrations (μmol/L) ± SD. *Adjusted P < 0.05, **adjusted P < 0.01 and ***adjusted P < 0.001. ns not significant.

