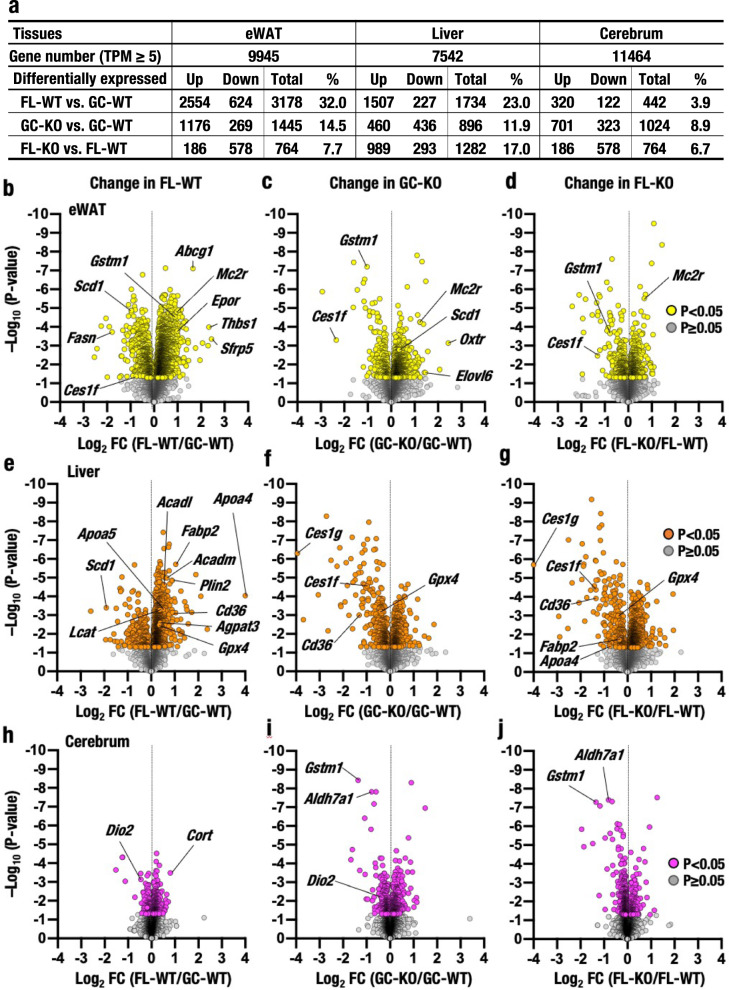
Fig. 6. RNA-seq analyses of the eWAT, liver and cerebrum.
a Numbers of total genes (mean TPM value ≥5) and differentially expressed genes (P < 0.05 according to the two-tailed test) identified in RNA-seq analyses of the eWAT, liver and cerebrum of GC-WT (n = 6), FL-WT (n = 6), GC-KO (n = 6) and FL-KO (n = 5) mice. b–j Volcano plots of RNA-seq analyses. The x-axis represents the log2 fold change (FC) in the eWAT (b–d), liver (e–g) and cerebrum (h–j) of FL-WT mice compared to GC-WT mice (b, e, h), GC-KO mice compared to GC-WT mice (c, f, i) and FL-KO mice compared to FL-WT mice (d, g, j). The y-axis represents the negative log10 of the two-tailed P value. Vertical dotted lines denote a fold change of one. Yellow (b–d), magenta (e–g) and orange (h–j) dots denote P < 0.05, and grey dots denote P ≥ 0.05 (b–j).

