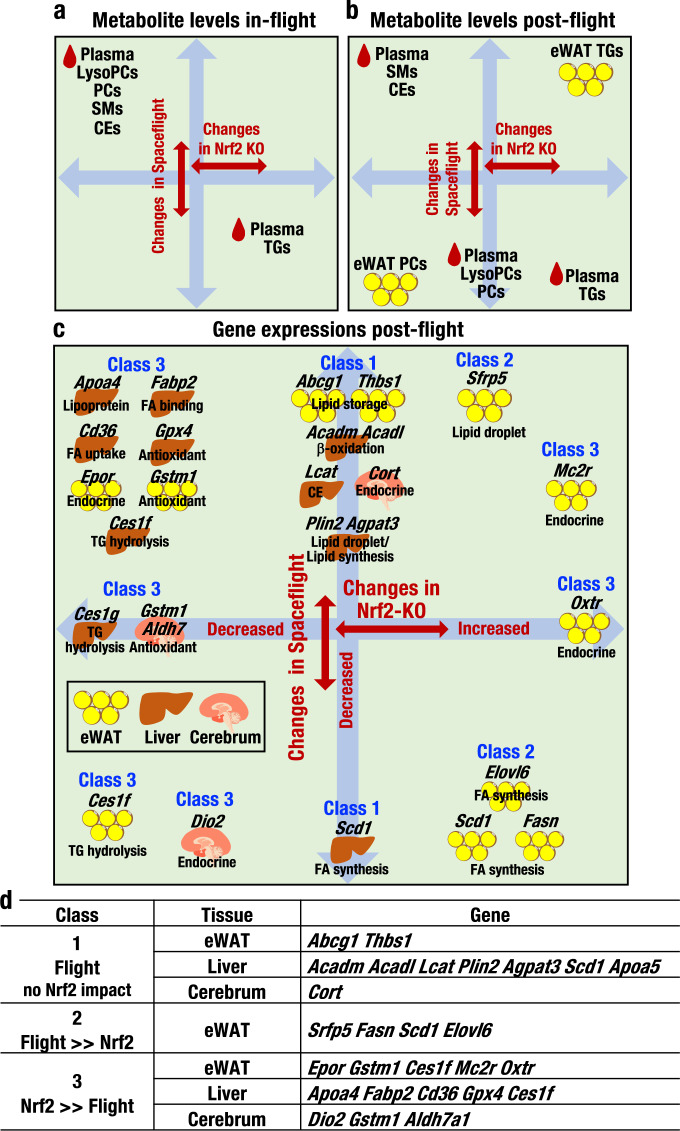
Fig. 8. Metabolic response and changes in gene expression during and after spaceflight.
a–c Schematic representations of metabolic responses during (a) and after (b) spaceflight. Vertical arrows denote changes in metabolite levels in the plasma and eWAT during (a) or after (b) spaceflight. Horizontal arrows denote these changes in Nrf2 KO mice. Schematic representations of changes in gene expression in the eWAT, liver and cerebrum after spaceflight are also provided (c). Vertical arrows denote changes in gene expression levels in the eWAT, liver and cerebrum after spaceflight (c). Horizontal arrows denote these changes in Nrf2 KO mice. d Classes of genes in the eWAT, liver and cerebrum. Class 1 includes genes with substantially altered expression in response to spaceflight that are not influenced by the Nrf2 KO genotype; Class 2 includes genes whose expression is affected by Nrf2 KO, but the changes are overridden by spaceflight; and Class 3 includes genes that are modulated by spaceflight, but the changes are overridden by Nrf2 KO.

