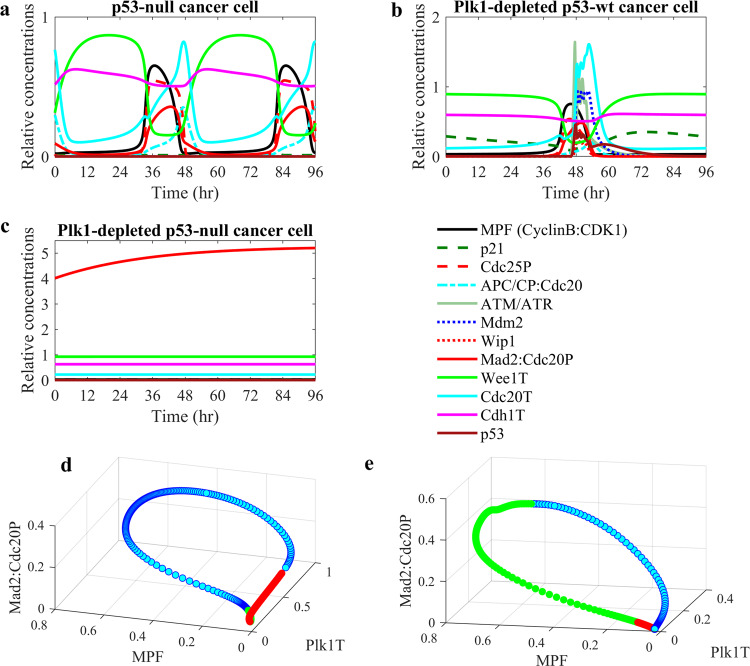
Fig. 3. Numerical simulations of Plk1 depletion in p53-wild-type and p53-null cancer cells.
a Dynamic behavior of model components in p53-null cancer cells. b Plk1-depleted p53-wt cancer cells. c Plk1-depleted p53-null cancer cells. The phase plots (d) and (e) show the limit cycles that correspond to simulations of p53-null and Plk1-depleted cells in (a) and (b). The limit cycle oscillations are directed counterclockwise from red to green. In the Plk1-depletion condition, Plk1 level was reduced by 70% relative to Plk1 level in cancer cells under normal conditions.

