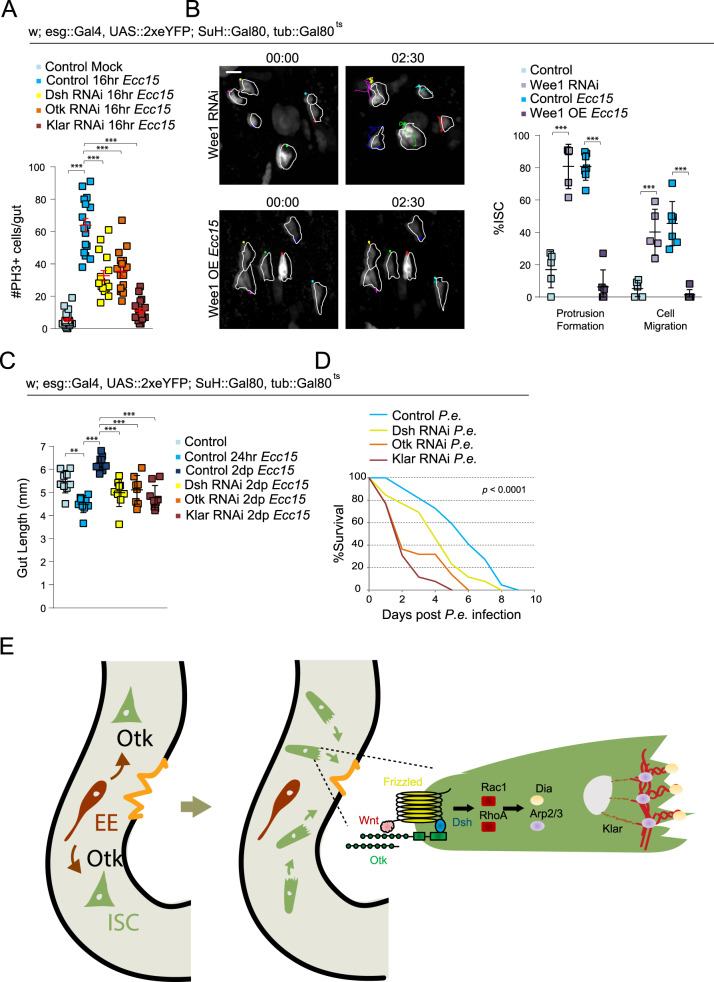
Fig. 6. Disrupting ISC migration impairs cell cycle progression and tissue regeneration.
A Quantification of mitotic numbers after disrupting ISC migration in intestines infected with Ecc15 for 16hrs. B Montage and quantification of ISC migratory behavior after modulating cell cycle progression. OE = overexpression. ISCs outlined in white, and montage tracks measured from the leading edge or, in cells that did not form protrusions, the most distal region of the cell cortex. Mock-treated and Ecc15-infected controls were taken from Fig. 1B, as they served as genetic controls. C Gut length decreases following 24 hrs of Ecc15 infection, but overcompensates after 2 days of recovery. Disrupting ISC migration impairs recovery. D P.e. was fed to 10d females continuously. Disrupting ISC migration decreased survival rates. E A model of non-canonical Wnt signaling-mediated regulation of ISC migration following injury. Mmp1 is activated in EE cells, which, in turn, facilitates activation of the non-canonical Wnt pathway, thereby promoting actin rearrangement. mean ± SEM (A) or mean ± SD (B, C); n = sample size as follows, A: 23 (Control Mock), 16 (Control Ecc15, Dsh RNAi, Otk RNAi), and 18 (Klar RNAi) flies from 2 independent experiments, B: 5 (Control, Wee1 RNAi), 7 (Control Ecc15), and 6 (Wee1 OE) flies from 5 (Control, Control Ecc15), 2 (Wee1 RNAi), and 4 (Wee1 OE) independent experiments, C: 9 (Control, Control 24 hr, Dsh RNAi, Klar RNAi), 10 (Control 2dp), and 8 (Otk RNAi) flies from 2 independent experiments, D: 44 (Control, Dsh RNAi) and 52 (Otk RNAi, Klar RNAi) flies from a single experiment, repeated two independent times with similar trends. **P < 0.01 (C: Control vs Control 24hr = 0.0014), ***P < 0.001 (A, B – Protrusion Formation, B – cell migration: control Ecc15 vs Wee1 OE, C: all except control 2dp vs Otk RNAi < 0.0001, B – Cell Migration: Control vs Wee1 RNAi = 0.0008, C: Control 2dp vs Otk RNAi = .0001), based on one-way ANOVA with Dunnett test (A), two-tailed Student’s t test (B), and one-way ANOVA with Tukey test (C). Individual P values of Fig. 6D = 0.0003 (Control vs Dsh RNAi), < 0.0001 (Control vs Otk RNAi, Control vs Klar RNAi), based on log-rank test (D). Scale bar = 10 µm. Timestamp indicated as hours:minutes. Source data are provided as a Source Data file. See also Supplementary Fig. 7, Supplementary Movies 24–25.

