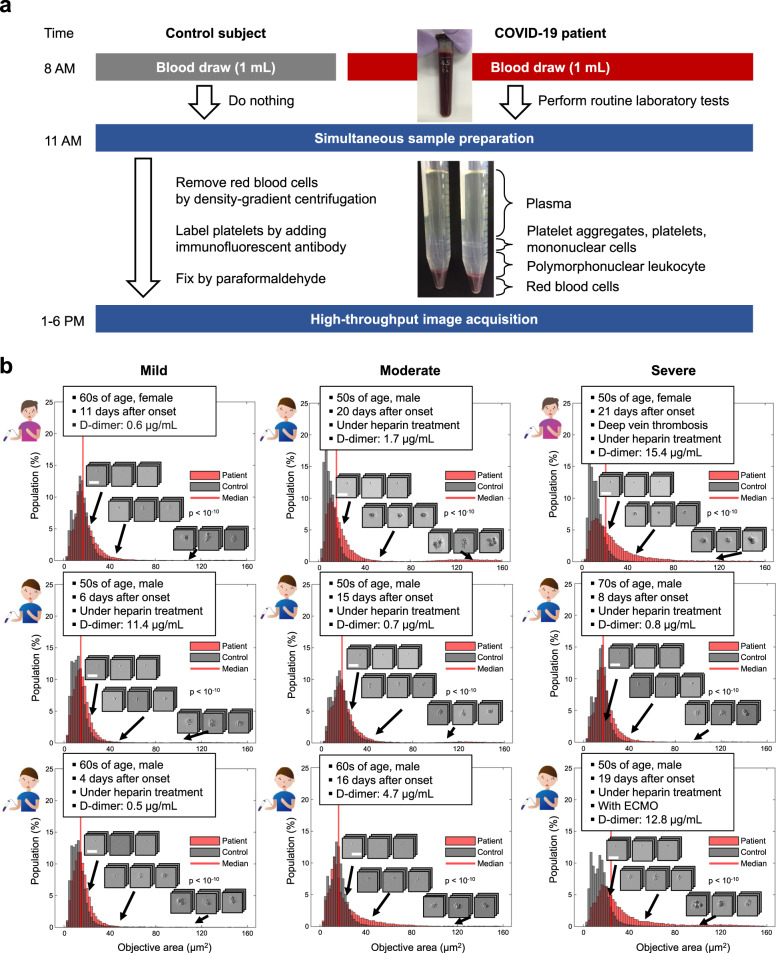
Fig. 2. Circulating platelet aggregates in the blood of COVID-19 patients.
a Sample preparation protocol. Control data were also obtained under the same sample preparation and image acquisition conditions on the same day to mitigate potential bias in the image data that may have come from experimental variations in blood draw, sample preparation, optical alignment, and hydrodynamic focusing conditions. See “Sample preparation” in the Methods section for details of the protocol. b Size distribution histograms and typical images of single platelets and platelet aggregates in the blood of mild, moderate, and severe patients with COVID-19. Scale bar: 30 µm. The clinical information and D-dimer level of each patient are also shown in the insets. Control data are also shown as references. P values were obtained using the Wilcoxon rank-sum test (two-sided) and shown in the figure. Source data are provided as a Source Data file.

