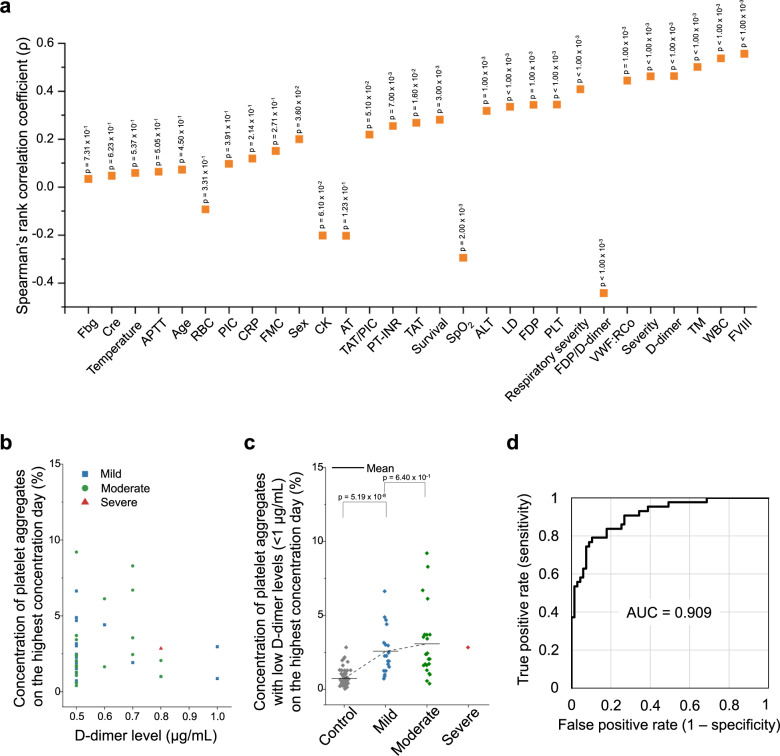
Fig. 5. Comparison with clinical laboratory tests.
a Comparison of the platelet aggregate concentration measured on the highest concentration day with clinical laboratory and physical findings. WBC leukocyte count, RBC red cell count, PLT platelet count, APTT activated partial thromboplastin time, PIC plasma plasmin-α2-plasmin inhibitor complex, CRP C-reactive protein concentration, FMC fibrin monomer complex, CK creatinine kinase, AT antithrombin, PT-INR prothrombin time international normalized ratio, TAT thrombin antithrombin complex, SpO2 oxygen saturation, ALT alanine transaminase concentration, LD lactate dehydrogenase concentration, FDP fibrinogen/fibrin degradation product, VWF:RCo von Willebrand factor activity, TM thrombomodulin, FVIII coagulation factor VIII activity, Temperature body temperature, Fbg fibrinogen level, Cre creatinine concentration. Exact p values were obtained using the spearman’s rank correlation test (two-sided) and shown in the figure. b Concentrations of platelet aggregates of patients with COVID-19 (39.1% of n = 110 biologically independent samples) and low D-dimer levels (≤1 µg/mL). c Comparison of the platelet aggregate concentrations of mild (n = 19 biologically independent samples), moderate (n = 23 biologically independent samples), and severe (n = 1 biologically independent samples) patients with COVID-19 and low D-dimer levels (≤1 µg/mL), measured on the highest concentration day of each hospitalized patient. p = 2.82 × 10⁻¹¹ with the two-sided Kruskal–Wallis test. P values of every two adjacent classes were obtained using the Mann–Whitney U-test (two-sided) and shown in the figure. d ROC curve of the data shown in Fig. 5c. Source data are provided as a Source Data file.

