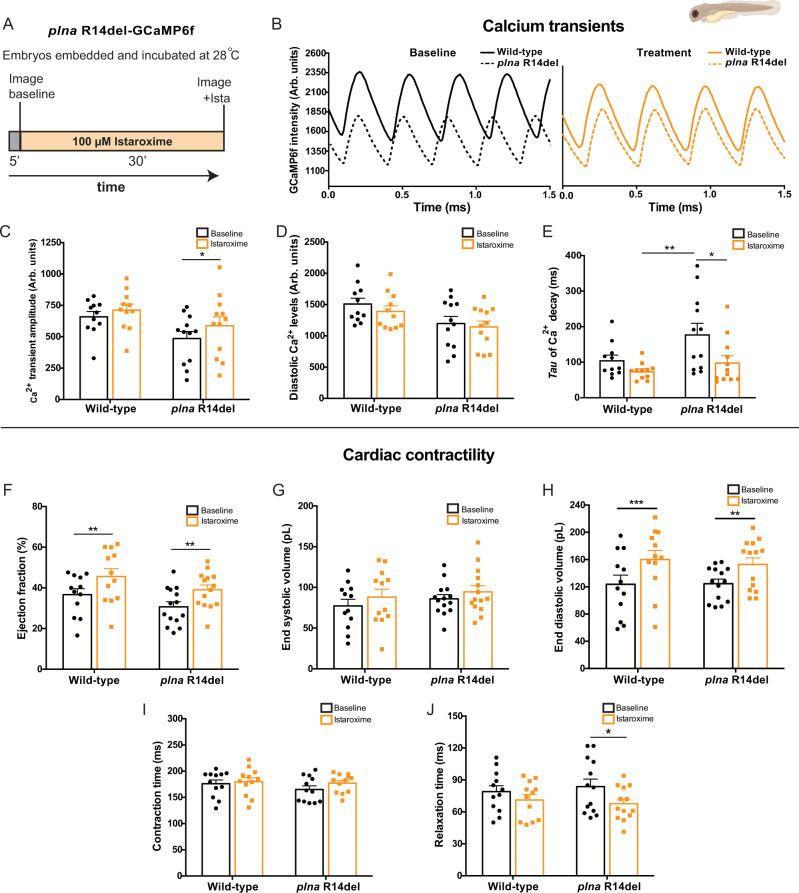
Fig. 6. Istaroxime improves cardiac calcium dynamics and cardiac relaxation in plna R14del embryonic zebrafish.
A Overview of the experimental setup. Embryos were embedded in agarose and incubated for 5 min at 28 °C. Baseline measurements were performed, and subsequently, embryos were incubated with 100 µM istaroxime for 30 min, and imaged again. B Representative calcium (Ca2+) transients from one wild type (WT) and one plna R14del embryonic zebrafish, before and after incubation with 100 µM istaroxime. C Ca2+ transient amplitude (mean ± SEM, *p = 0.0324, WT baseline n = 11, WT istaroxime n = 11, plna R14del baseline n = 12, plna R14del istaroxime n = 13, two-way ANOVA). D Diastolic Ca2+ levels and E Tau of Ca2+ decay in WT and plna R14del zebrafish, at baseline and after incubation with 100 µM istaroxime (mean ± SEM, *p = 0.0439, **p = 0.0049, WT baseline n = 11, WT istaroxime n = 11, plna R14del baseline n = 12, plna R14del istaroxime n = 13, two-way ANOVA). F–J Bar graphs of contractility parameters at baseline and after incubation with 100 µM istaroxime, including end-systolic volume F (mean ± SEM, **p = 0.005988 for WT and **p = 0.005588 plna R14del, WT baseline n = 12, WT istaroxime n = 12, plna R14del baseline n = 14, plna R14del istaroxime n = 15, two-way ANOVA), end-diastolic volume G, ejection fraction H (mean ± SEM, ***p = 0.0002, **p = 0.0015, WT baseline n = 11, WT istaroxime n = 11, plna R14del baseline n = 12, plna R14del istaroxime n = 13, two-way ANOVA), contractile cycle length contraction time I and contractile cycle length relaxation time J (mean ± SEM, *p = 0.0006, WT baseline n = 11, WT istaroxime n = 11, plna R14del baseline n = 12, plna R14del istaroxime n = 13, two-way ANOVA). All measurements were performed in three experimental replicates. Statistical test two-way ANOVA. Baseline condition is highlighted in black and treated in orange. Arb. units arbitrary units, ms milliseconds, pL picoliter. Source data are provided as a Source Data file.

