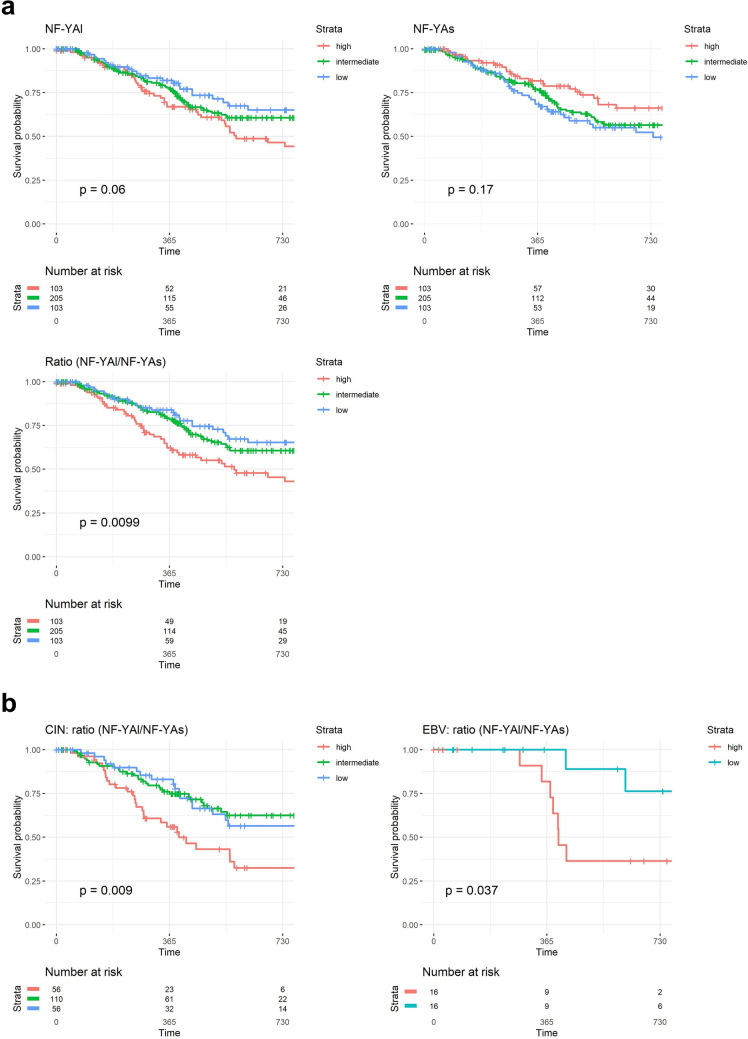
Figure 4.
Clinical outcome of NF-Y expression according to the TCGA classification. (a) Upper Panels, Progression-Free-Interval-PFI-curves of survival probability of STAD tumors with stratification according to quartiles of NF-YA long and short isoforms (Intermediate, High and Low). PFI curves of NF-YAl/NF-YAs ratios are shown in the Lower Panel. We stratified all available tumors in the three groups according to the TPM levels: Low = first quartile, high = fourth quartile and intermediate for values included in the two middle quartiles. p values are calculated using the log-rank test. (b) PFI curves of the NF-YAl/NF-YAs ratios in the CIN (Left Panel) and EBV tumors (Right Panel). In this latter case, we stratified samples in two bins, High (third and fourth quartiles) and Low (first and second quartiles).

