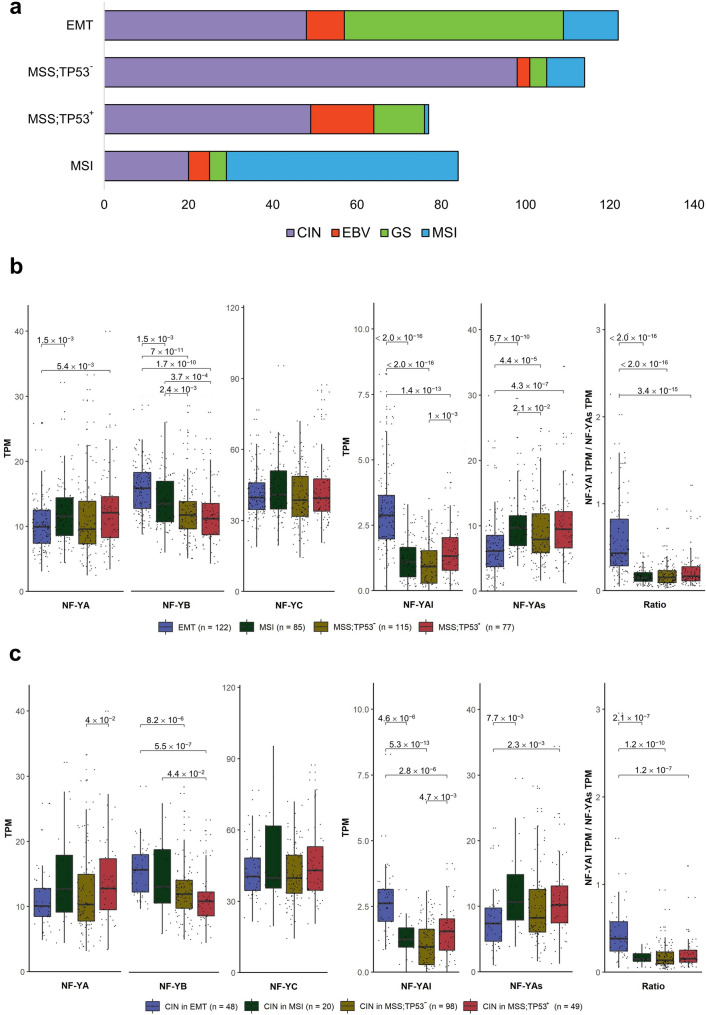
Figure 5.
NF-Y expression in the ACRG subtypes. (a) Partitioning of TCGA subtypes in the four ACRG subtypes, according to the classification of TCGA RNA-seq dataset. (b) Box plot analysis of NF-Y subunits (Left Panel) and NF-YA isoforms (Right Panel) in the four ACRG subtypes. (c) Same as (b), except that expression was computed in the TCGA CIN samples partitioned in the ACRG subtypes. p values are calculated using the Wilcoxon rank-sum test.

