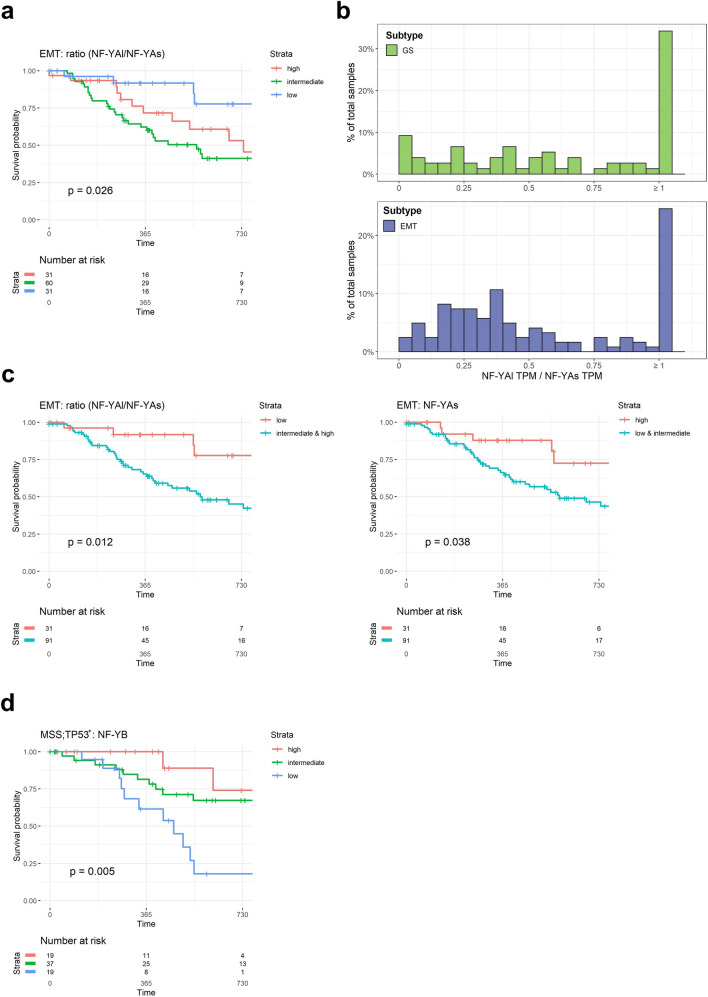
Figure 6.
Clinical outcome of NF-Y expression according to the ACRG classification. (a) Progression-Free-Interval curves of survival probability of EMT tumors with stratification according to quartiles of NF-YAl/NF-YAs ratio (Intermediate, High and Low). We stratified all available tumors in the three groups according to the ratio levels: Low = first quartile, High = fourth quartile, and Intermediate for values included in the two middle quartiles. p values are calculated using the log-rank test. (b) Distribution of NF-YAl/NF-YAs ratios in the TCGA GS (Upper Panel) and ACRG EMT (Lower Panel) samples. The width of each bin was set to 0.05, and ratios equal to or greater than one were included in the last bin. (c) PFI curves in EMT tumors of NF-YAl/NF-YAs (Left Panel) and NF-YAs (Right Panel) stratified in Low and Intermediate/High values or High and Intermediate/Low, respectively. (d) Same as (a), except that the levels of NF-YB expression were correlated to prognosis in MSS;TP53+ tumors.

