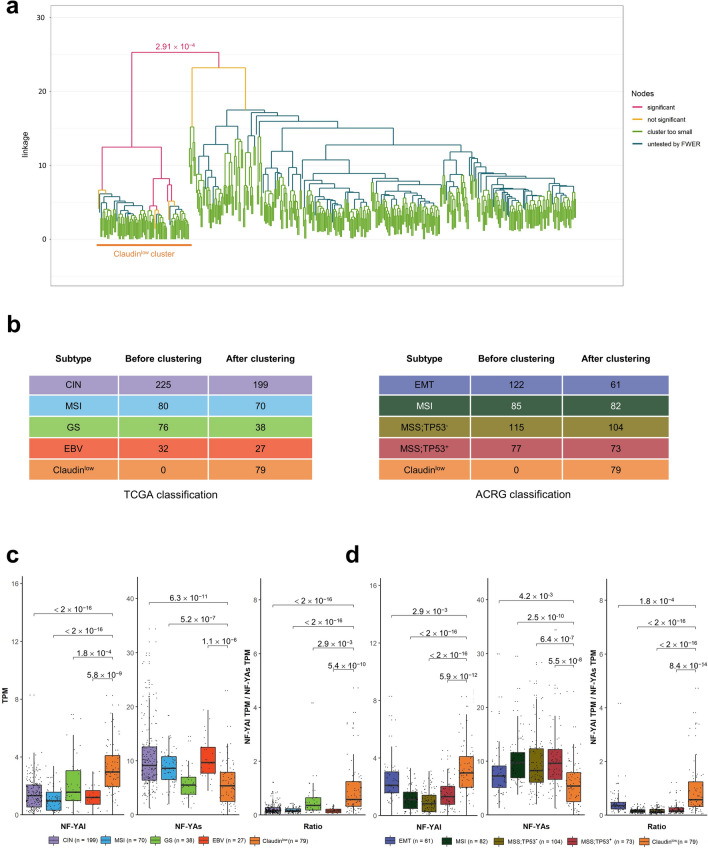
Figure 7.
NF-YAl is predominant in Claudinlow STAD tumors. (a) Hierarchical clustering of all TCGA tumor samples according to the 24 genes signature described in Ref. 37. (b) Sample repartition in the TCGA (Left Panel) and ACRG (Right Panel) classifications, including the new Claudinlow group identified in (a), before and after the clustering procedure. (c) Box plots of expression levels of NF-YAl (Left Panel), NF-YAs (Central Panel), and NF-YAl/NF-YAs ratio (Right Panel) in the TCGA classification, including the Claudinlow group identified in (a). (d) Same as (c), except that the NF-YA isoforms expression levels are calculated for the ACRG classification subtypes. p values are calculated using the Wilcoxon rank-sum test.

