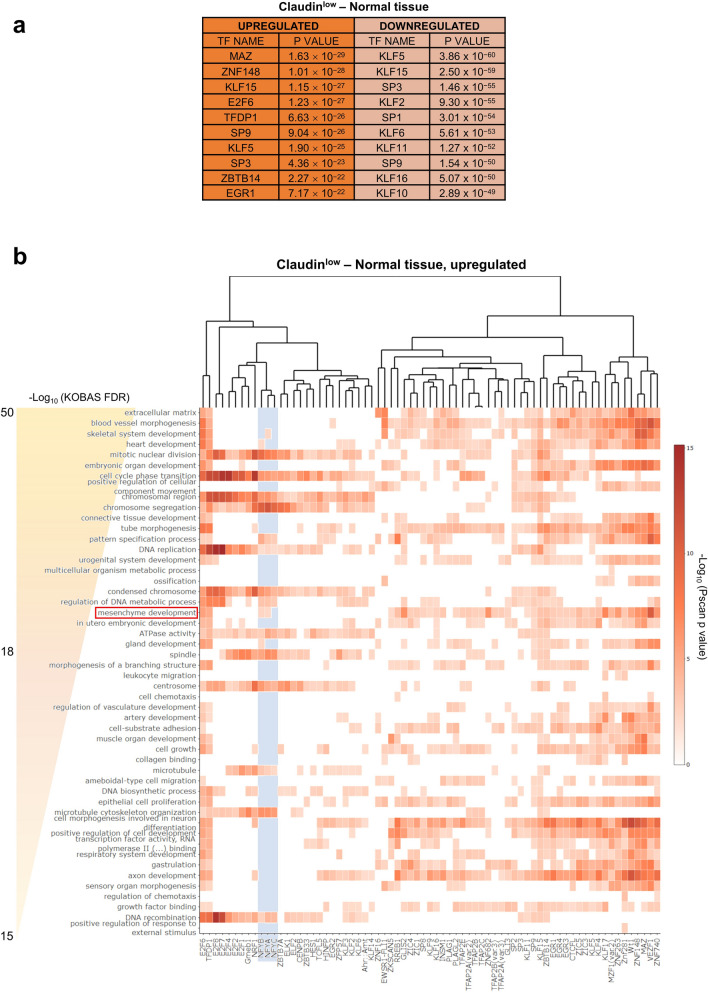
Figure 8.
DEG in Claudinlow subtype. (a) List of enriched TFBS in promoters of upregulated and downregulated genes in the Claudinlow subtype, compared to normal tissue, as predicted by Pscan. (b) Heatmap showing the p values, as computed by Pscan, associated to the enrichment in multiple TFBS motifs (columns) of the top 50 most represented GO terms (rows) among upregulated genes in Claudinlow samples, as emerged from the KOBAS analysis. The light blue area highlights NF-Y subunits binding site motifs (CCAAT box). Only terms with less than 500 background genes and TFBS with a significant enrichment in more than 10 terms (p < 0.01) were included in the heatmap.

