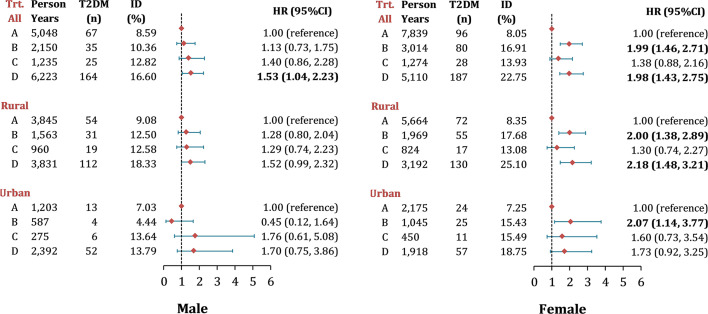
Figure 3.
Risk of new-onset T2DM by different LAP transitions in middle-aged and older Chinese. Note: Data were presented as n (%) and hazard ratios (95% CI), adjusted for age, education, region, hypertension, smoking, drinking, general obesity, TC, LDL-c level and HDL-c level; Hazard ratios for T2DM by LAP transitions were calculated using multivariable Cox frailty models with random effect, by which means clustering of participants was accounted for; P< 0.05 were highlighted in bold. ID, incidence density; LAP, lipid accumulation product; Trt., transition types during follow-up, the definition from group A to D were listed as following: Group A, maintain Low LAP during follow-up; Group B, Low LAP at baseline turned to High LAP at follow-up; Group C, High LAP at baseline turned to Low LAP at follow-up; Group D, maintain High LAP during follow-up.

