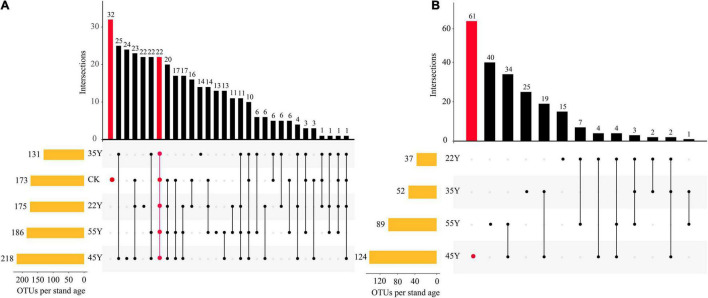
FIGURE 3.
UpSet plots show the relationships of AM fungi OTUs between rhizosphere soils (A) and roots (B) of teak along a chronosequence. The left panel displays orange bars for each stand age that represent the number of AM fungi OTUs. Dark circles in the matrix indicate sets of treatment that intersect. The two intersection queries are the one-way intersection of CK (red) and the five-way intersection of all 5 stand ages in the rhizosphere soils. The one intersection query is the one-way intersection of 45Y (red) in the roots.

