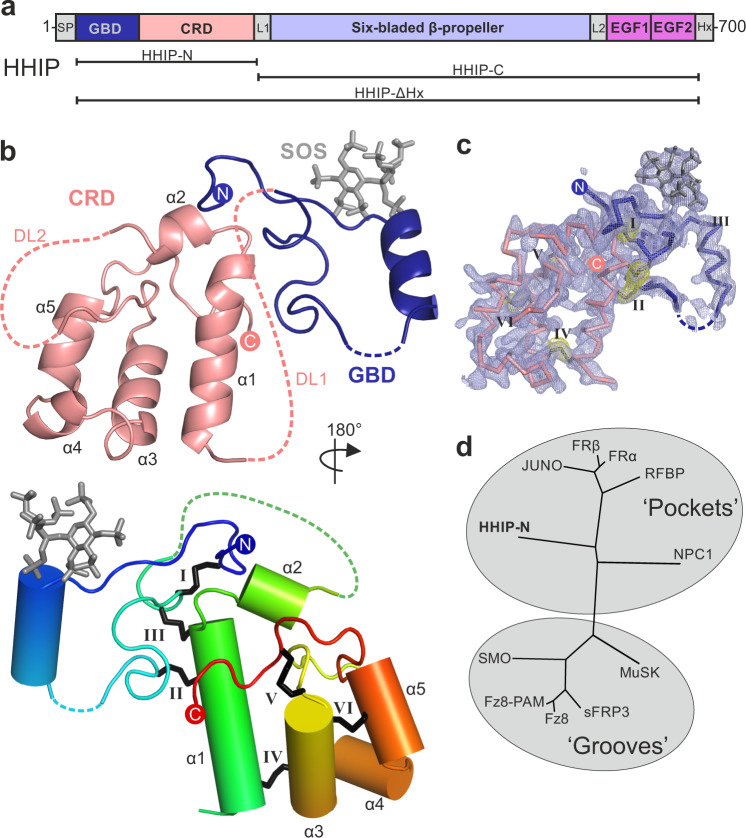
Fig. 1. The structure of HHIP-N.
a HHIP domain organisation and construct design. b Cartoon representation of HHIP-N in complex with SOS. In the top panel, the CRD region is depicted in salmon and the N-terminal GAG-binding domain in dark blue. Two disordered loops (DL1 and DL2) are displayed as dashed salmon lines. In the lower panel, the HHIP-N:SOS complex is shown in rainbow colouring (blue: N-terminus, red: C-terminus). The CRD helices are labelled and disulphide bonds are numbered using Roman numerals. c Maps calculated from final HHIP-N model. The 2Fo-Fc map is shown in blue, contoured at 1σ. An anomalous difference map calculated from S-SAD data used for phasing is displayed as a yellow mesh contoured at 4σ. Corresponding disulphide bonds are numbered using Roman numerals. d Structural phylogenetic analysis of CRDs (see Supplementary Table 2).

