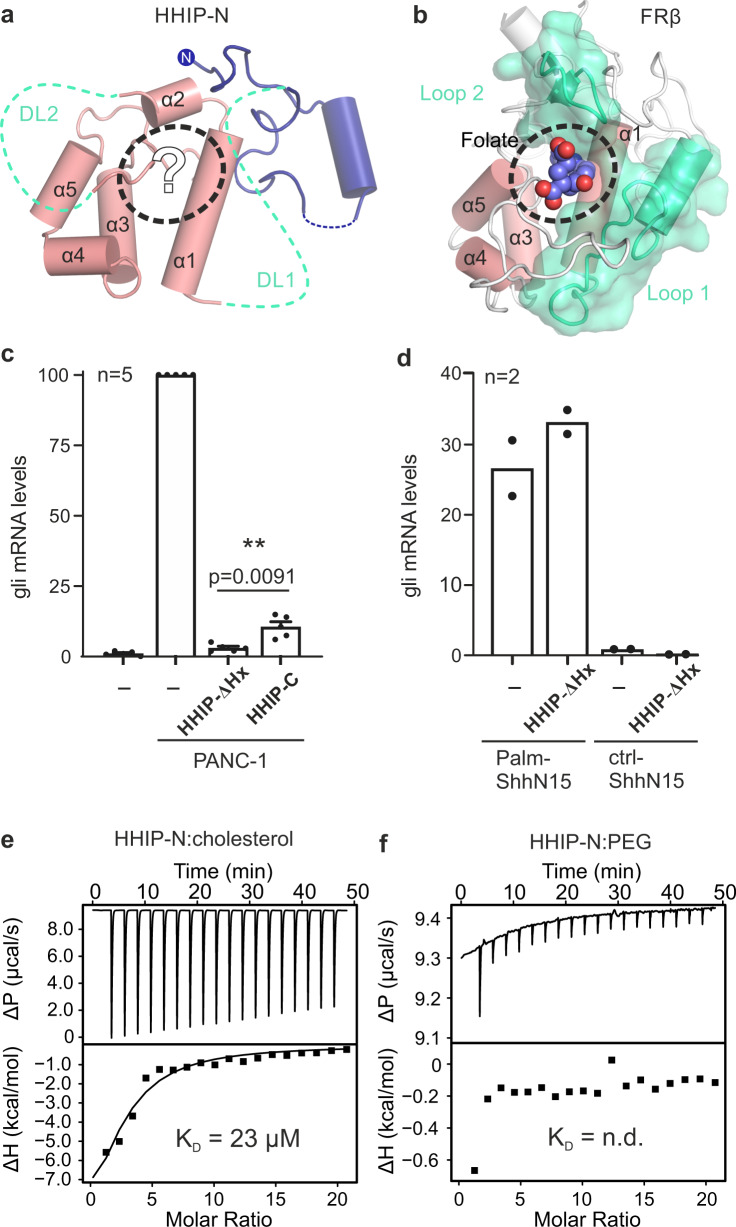
Fig. 2. HHIP-N CRD contributes to HH signalling inhibition.
a, b Structural homology of HHIP-N with CRDs suggests small molecule interaction. HHIP-N (a) is shown, with missing loops DL1 and DL2 displayed as green dashed lines and helices are annotated α1-5. A potential ligand-binding pocket is outlined with a dashed circle. FRβ (b) binds a folate molecule (spheres, circled), utilising loops structurally analogous to HHIP-N DL1 and DL2 (coloured green). Helices are annotated α1-5 as in HHIP-N. c RT-PCR assay from NIH/3T3 cells co-cultured with PANC-1 cells expressing pShhNc to quantify Hh signalling in the presence of HHIP constructs. Relative levels of Gli1 mRNA were quantified and normalised from 5 independent experiments and displayed as mean values ± SEM, with statistical significance calculated using a two-tailed, paired t-test with p = 0.0091. d HH signalling assay to assess HHIP-∆Hx inhibition of pathway activation in response to a palmitoylated N-terminal pShhNc peptide. e Raw ITC (upper panel) and binding isotherm (lower panel) for titration of PEG-cholesterol into HHIP-N. f Raw ITC (upper panel) and binding isotherm (lower panel) for titration of unconjugated PEG200 into HHIP-N. Source data are available as Source Data file.

