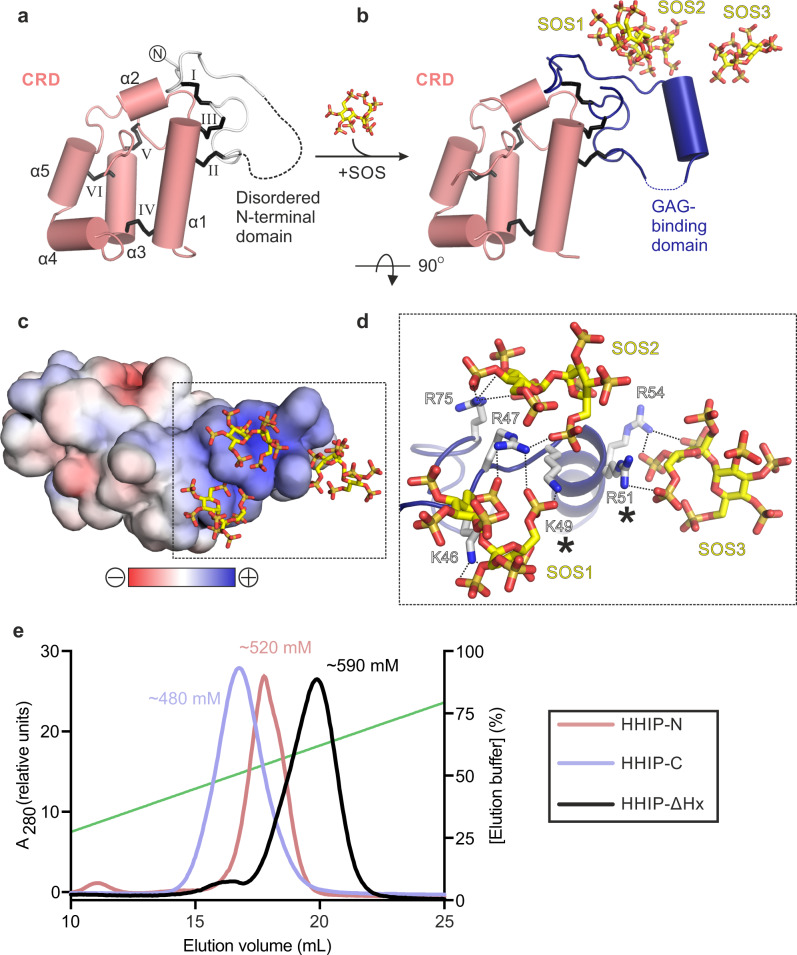
Fig. 3. HHIP-N:GAG interactions.
a, b Comparison of the apo HHIP-N structure (a) and HHIP-N:SOS complex. Colour coding is as in Fig. 1b. For HHIP-N:apo, the disordered GAG-binding domain is shown as a dashed line. In the HHIP-N:SOS complex three SOS molecules interact with the GAG-binding domain. c Electrostatic surface potential of the HHIP-N:SOS complex, displayed from −10 kT/e to +10 kT/e. d Close-up view of HHIP-N:SOS binding site showing the region marked in C. Hydrogen bonds are shown as dashed lines (c, d rotated 90° around the x-axis relative to B). Mutations previously observed to decrease GAG-binding affinity and cause dysfunction of HHIP are marked with asterisks28. e Heparin affinity chromatography of different HHIP constructs eluted from a linear gradient of NaCl from 20 to 1000 mM (green line). Traces corresponding to different constructs are coloured according to the accompanying legend (inset).

