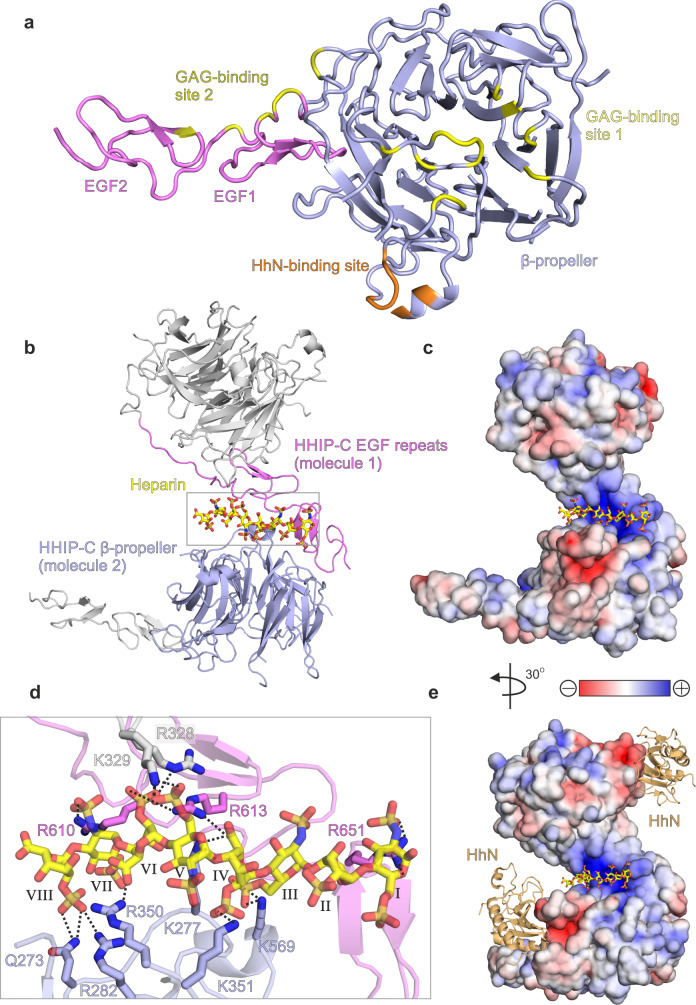
Fig. 4. The structure of the HHIP-C:heparin complex.
a Cartoon representation of the HHIP-C monomer structure with the β-propeller domain in slate, the EGF repeats in magenta, the GAG-binding sites in yellow and the HhN-binding site in orange. b Arrangement of the two HHIP-C molecules (cartoon representation) around a centrally-coordinated heparin molecule (stick representation). c Close-up view of the boxed region in B, displaying side chain:heparin interactions. Hydrogen bonds are displayed as black dashed lines and sugar residues are numbered using roman numerals (odd, N,O6-disulphoglucosamine; even, O2-Sulphoiduronic acid). d Electrostatic surface potential shown from red (−8 kT/e) to blue (+8 kT/e) with heparin chain shown as sticks. e Comparison of heparin (yellow sticks) and HhN (orange cartoon) interaction sites on HHIP-C electrostatic surface.

