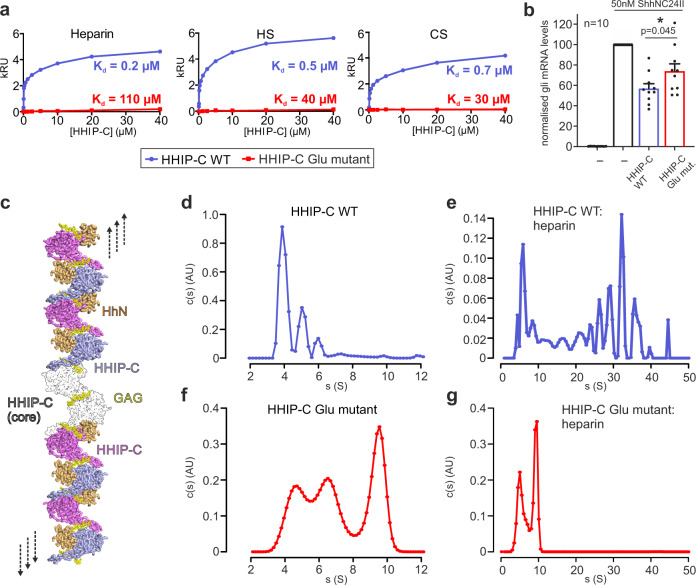
Fig. 5. Analysis of HHIP-C:GAG interactions and oligomerisation.
a Comparative SPR curves for HHIP-C WT (light blue) and HHIP-C Glu mutant (red) binding to heparin, heparan sulphate (HS) and chondroitin sulphate (CS); b Quantification of HH pathway inhibition with the addition of HHIP-C WT or HHIP-C Glu mutant. Relative levels of Gli1 mRNA were quantified from 10 independent experiments, with statistical significance calculated using a two-tailed, paired t-test with p = 0.045; Data are presented as mean values ± SEM. c Model for cell surface HHIP-C oligomeric assembly. GAG chains (represented by heparin, yellow) stabilise a core anti-parallel HHIP-C dimer (surface; black and white) and can then recruit further HHIP-C chains (light blue, violet) to form long oligomeric chains. This facilitates binding and antagonism of multiple HhN ligands (orange). d, e AUC experiments to assess the oligomerisation of HHIP in solution, comprising HHIP-C (d) and HHIP-C:heparin 30-mer complex (e); f, g As in (c, d), comprising HHIP-C Glu mutant (e) and HHIP-C Glu mutant mixed with 30-mer heparin (f). Source data are available as Source Data file.

