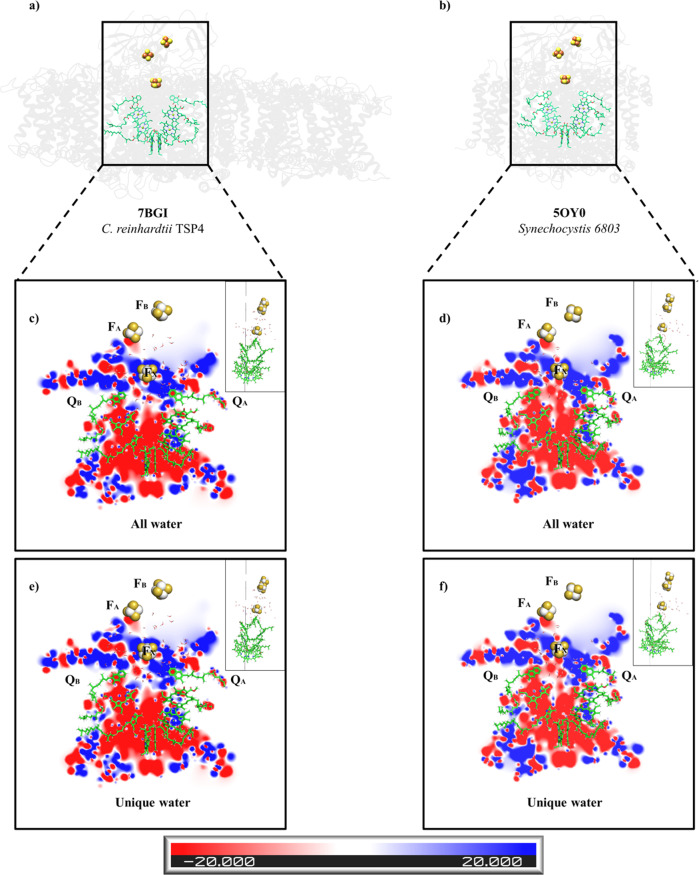
Fig. 4. The electrostatic potentials of the C. reinhardtii TSP4 and Synechocystis PSI RC.
The structure of C. reinhardtii TSP4 (a) and Synechocystis PSI (b) from a membrane plane view. For clarity, only the ligands of the proteins (chlorophylls, quinones and the iron-sulphur clusters) and the water molecules are presented and are marked with a rectangle. The electrostatic potentials were calculated on two conditions: with all of the water molecules found within a 10 Å radius of the FX of C. reinhardtii TSP4 (c), or Synechocystis (d), or the water molecules that constitute a unique subset to C. reinhardtii TSP4 (e), or Synechocystis (f). In each case presented hereafter (Supplementary Figs. 11–13), the electrostatic potentials are mapped onto three parallel slices, each located at a different position along the RC Y-axis (see the small image on the right side of each figure, showing the RC orthogonally, i.e. rotated 90° when compared with the main image). The negative potentials (0 kBT/e > Φ > −20 kBT/e) are red, the positive potentials (0 kBT/e < Φ < 20 kBT/e) are blue, and the neutral potentials are white (see the colour code at the bottom). Noticeable changes in electrostatic potential appear in the region between the quinones and FX, marked by black circles.

