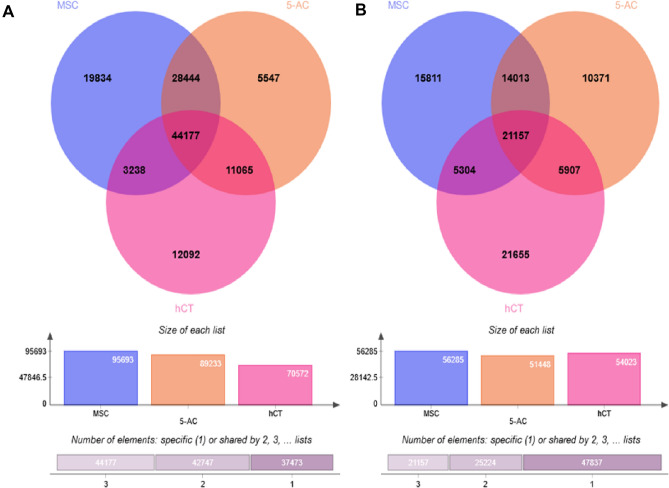
Fig. 2.
Global comparative methylation profiling in Venn diagram representation- Differentially methylated genes obtained in 180 K microarray analysis was represented in the form of Venn diagram depicting both overlapping genes and uniquely expressing in the samples compared, i.e., native MSCs, 5-AC-treated MSCs and human cardiac tissue. Comparative analysis obtained from native MSCs, 5-Aza-treated MSCs and cardiac tissue control. A Hypomethylated CpGs, B hypermethylated CpGs

