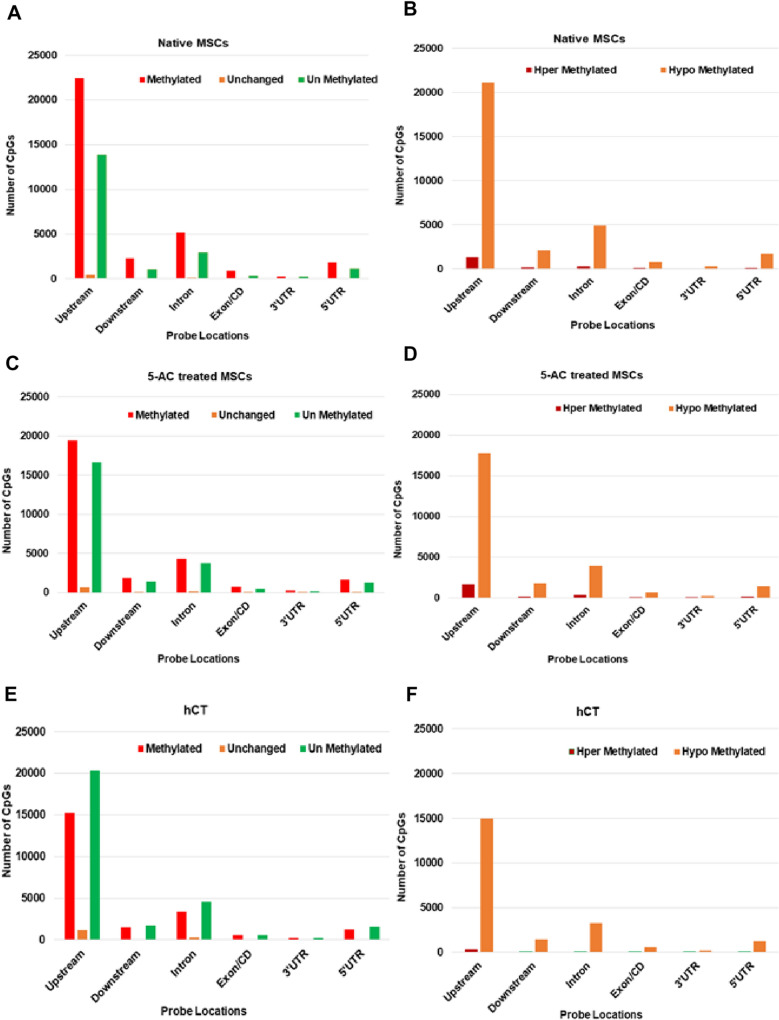
Fig. 3.
Functional genomic distribution with probe locations of CpGs in samples analyzed—A–F) Bar charts representing overall genomic distribution of CpGs across the genome in all the three samples. Data portrayed the occurrence of more CpGs at the promoter region and the least at the 3’ prime UTR region, respectively

