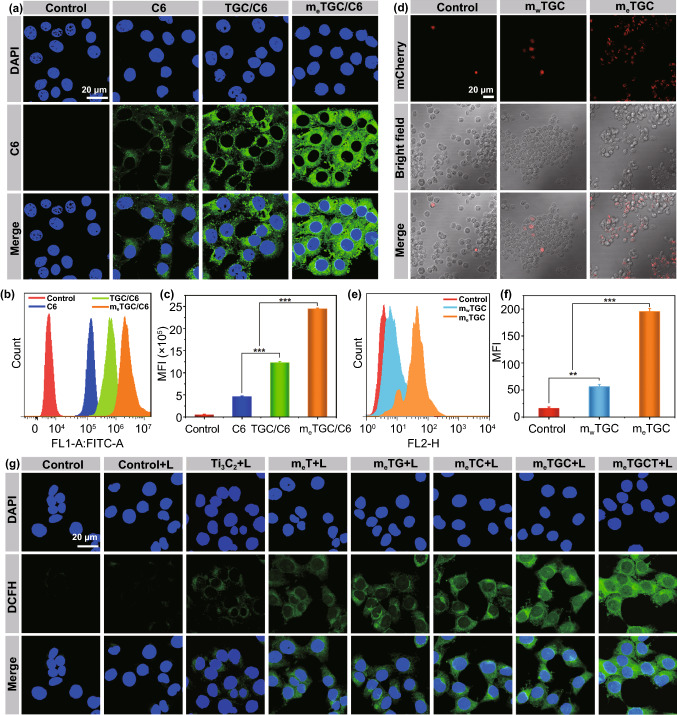
Fig. 4.
a CLSM results of 4T1 cells uptake toward TGC/C6 and meTGC/C6 at 4 h. b Flow cytometric results and c quantitative flow analysis of 4T1 cells uptake of C6-labeled different formulations. d CLSM results of 4T1 cells were swallowed by macrophages after different treatments with mwTGC and meTGC. e Flow histogram analysis and f quantitative flow analysis of 4T1 cells swallowed by macrophages after treatments with mwTGC and meTGC. g CLSM results of intracellular ROS level. (***p < 0.001, **p < 0.01, n = 3)

