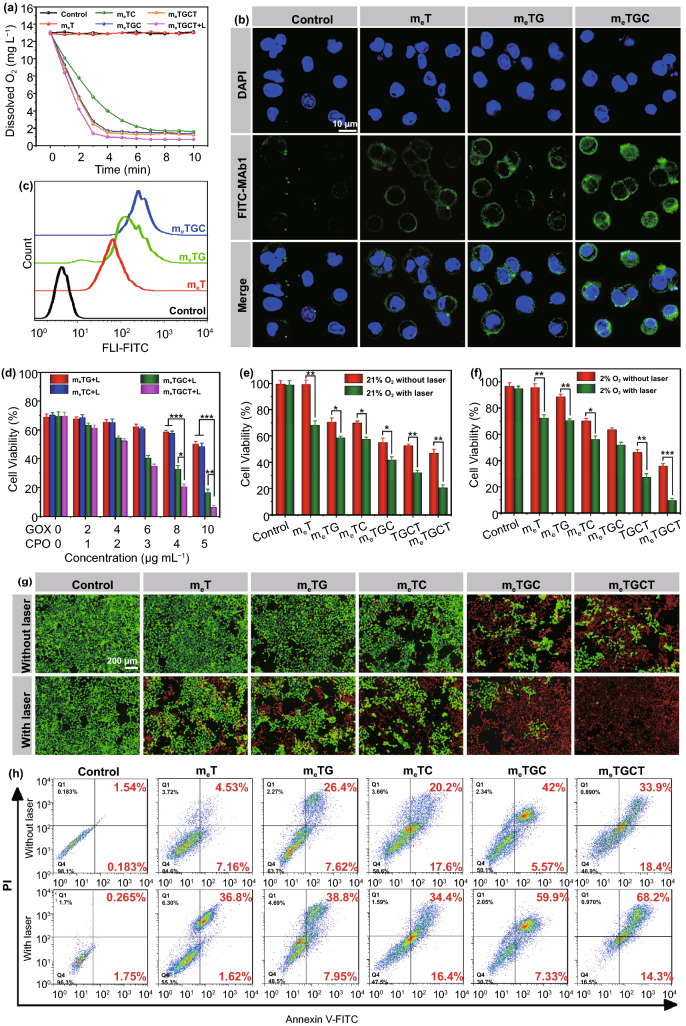
Fig. 5.
a Change of dissolved O2 in 4T1 cells treated with different formulations. b CLSM images and c flow histogram of cellular hypoxia of 4T1 cells incubated with different formulations using a hypoxia probe. d Cell viability of 4T1 cells treated with meTG, meTC, meTGC, and meTGCT with various GOX/CPO concentrations under 808 + 635 nm lasers irradiation. Cell viability of 4T1 cells incubated with various formulations in e 21% O2 condition and f 2% O2 condition with/without laser irradiation. g Live/dead staining images and h cell apoptosis of 4T1 cells after various treatments for 4 h (***p < 0.001, **p < 0.01, *p < 0.05, n = 5)

