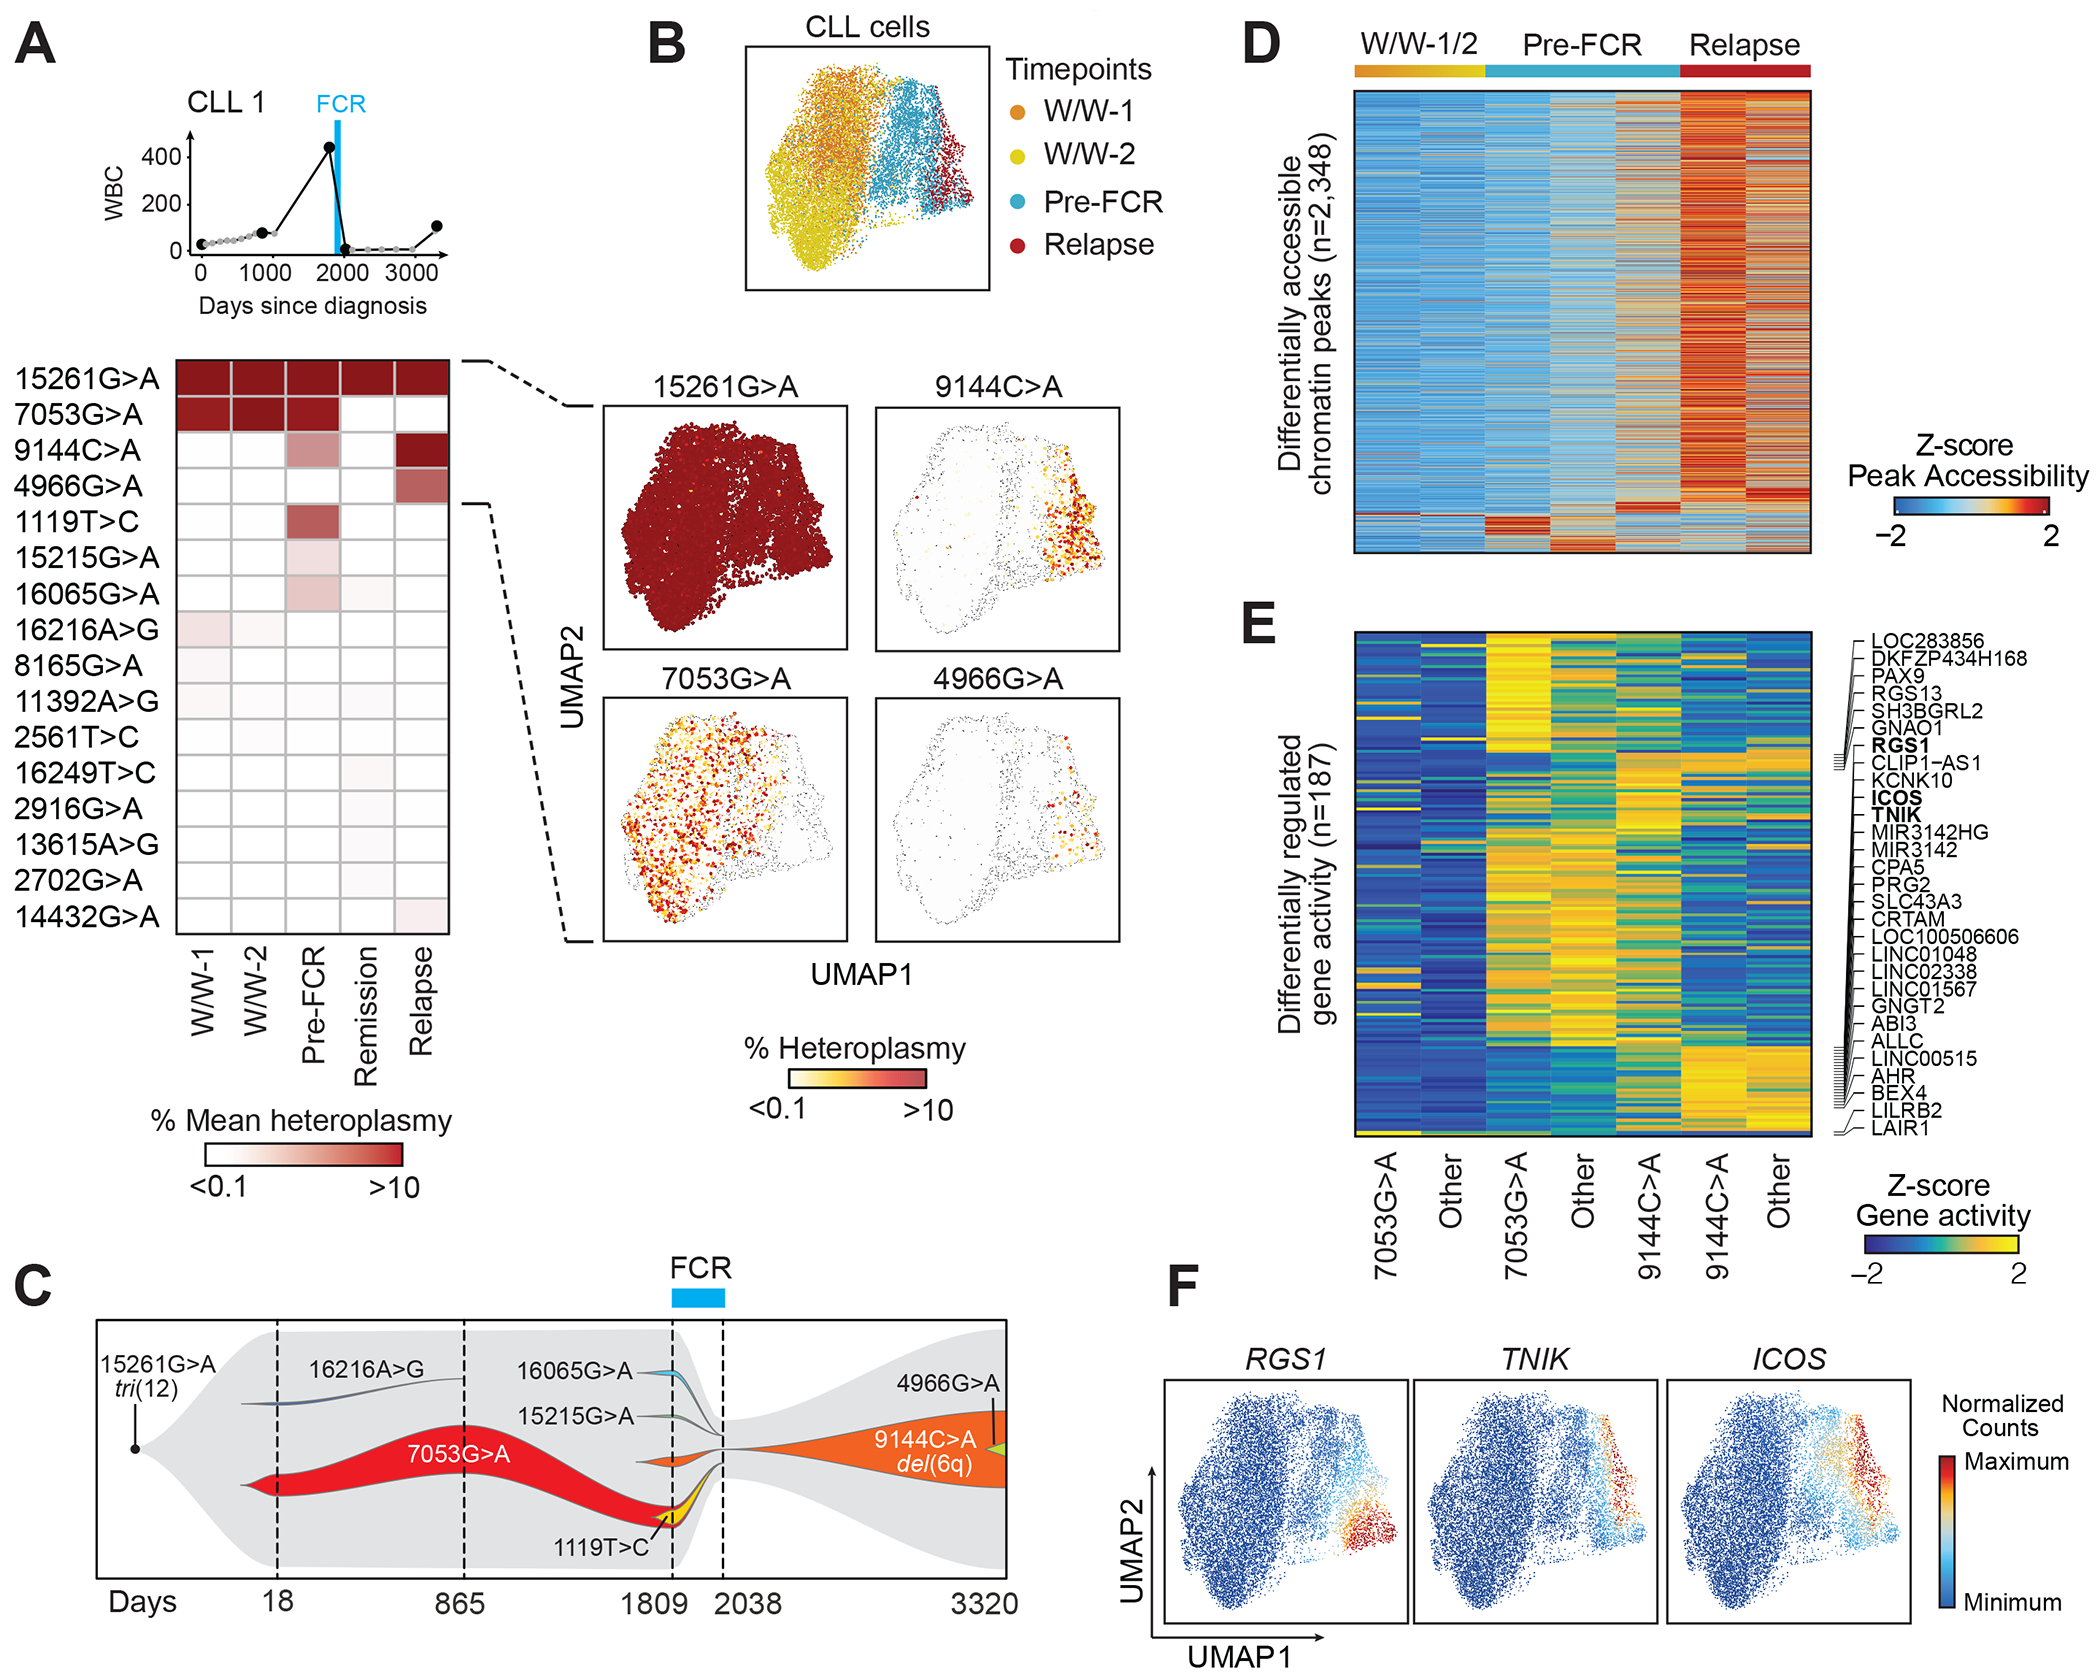
Fig. 2. Mitochondrial DNA mutations as long-term markers of disease evolution.

(A) Clinical information and mean heteroplasmy of mtDNA mutations at 5 timepoints (CLL1). FCR - fludarabine, cyclophosphamide and rituximab chemoimmunotherapy. 16 of 43 identified mtDNA mutations (mean heteroplasmy >0.01%) are displayed. For a complete list see Suppl. Table 2.
(B) UMAP plots of single CLL cells, clustered based on chromatin accessibility profiles, demonstrating distinct clusters based on timepoints (top). The heteroplasmy of 15261G>A, 7053G>A, 9144C>A and 4966G>A are shown in the individual panels, and segregate in distinct cell clusters.
(C) Trajectory of subclonal structure inferred from mean heteroplasmy of mtDNA mutations and copy number changes, derived from scATAC-seq data (see Suppl. Fig. 3).
(D, E) Chromatin accessibility of differentially expressed peaks and gene activity scores in CLL cells during watch and wait (W/W-1/2), before FCR chemotherapy (Pre-FCR) or at relapse marked by 7053G>A, 9144C>A or other mutations.
(F) Integrated scRNA-seq expression counts of RGS1, TNIK and ICOS projected onto the CLL1 scATAC-seq UMAP.
