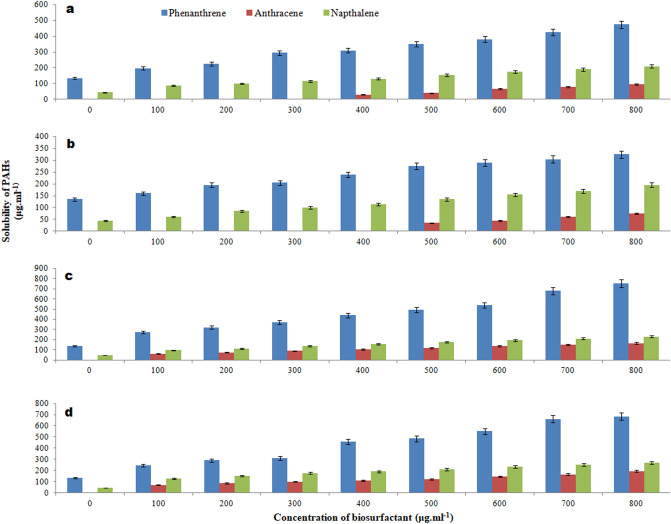
Fig. 8.
PAH solubilization assay showing the decrease in the available phenanthrene, anthracene and naphthalene concentration with increasing concentration of biosurfactants produced by a P. aeruginosa OBP1, b P. aeruginosa OBP2, c P. aeruginosa OBP3, and d P. aeruginosa OBP4. Values are the mean of three independent experiments ± standard deviation

