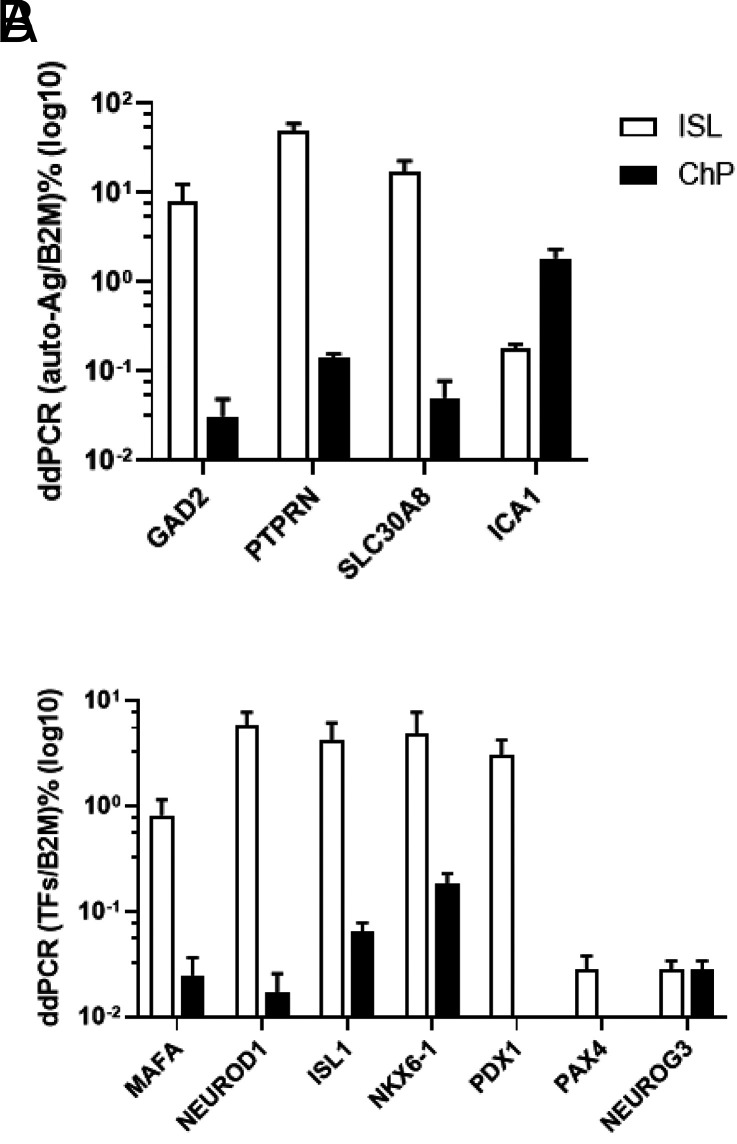
Figure 4.
A–B: ddPCR quantification of autoantigens and transcription factors. A: Comparison of autoantigen expression in islets (ISL) and ChP. B: Comparison of INS gene transcription and differentiation factors in ISL and ChP. y-axis is logarithm values of the target gene as percentages of β2 microglobulin (B2M) (normalized droplets).

