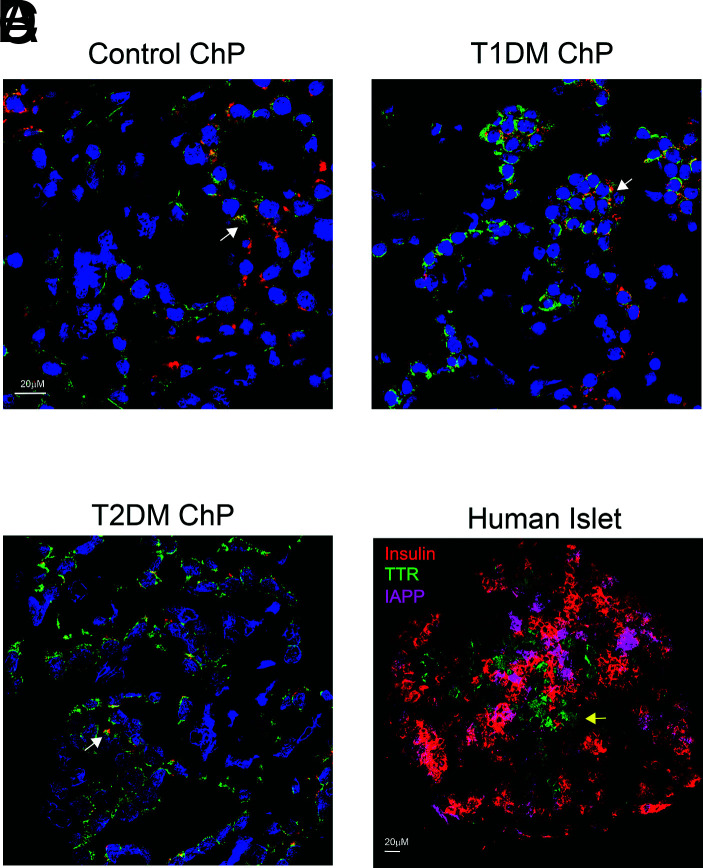
Figure 5.
A–D: Confocal microscopy images of triplex RNAscope ISH in control ChP (A), T1DM ChP (B), and T2DM ChP (C) (×40 with DAPI staining) and human islets (D) (×20 omitting DAPI staining). Red represents INSU; green, TTR; and magenta, IAPP probes. White arrows indicate colocalization of INSU with TTR in ChP, and yellow arrow shows that TTR does not colocalize with either insulin or IAPP in islet.

