Figure 3.
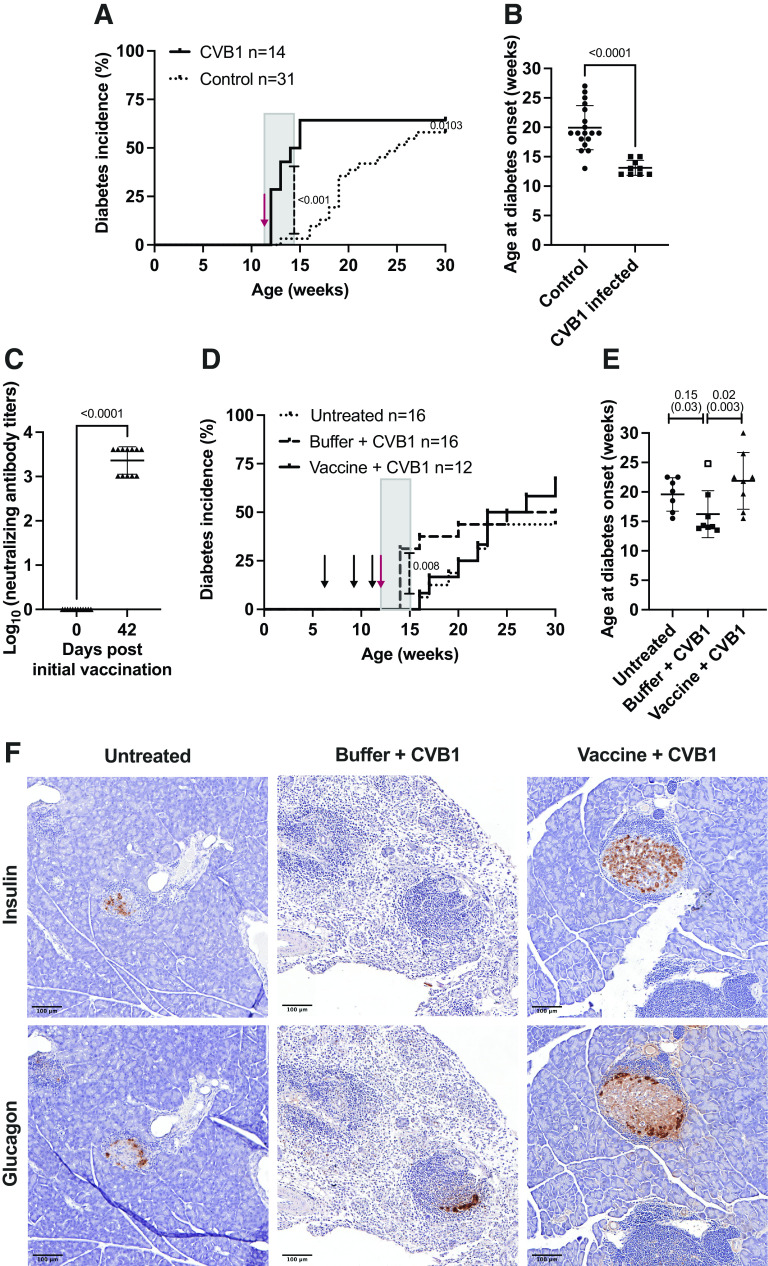
CVB1 vaccine protects against CVB1-accelerated disease in NOD mice. A and B: Female NOD mice were left untreated (control; n = 31) or infected with CVB1 (107 PFU by i.p. injection; total volume, 200 μL) between 10.5 and 13.5 weeks of age (n = 14), and diabetes incidence was followed up to 30 weeks of age. A: Diabetes incidence curves of the two groups. The red arrow indicates the mean age at infection. The gray box shows the 2-week period after virus infection. P < 0.001 when comparing the diabetes incidence curves during this period by the Gehan-Breslow-Wilcoxon test. P = 0.0103 comes from the comparison of the two curves up to 30 weeks of age by the Gehan-Breslow-Wilcoxon test. B: Age at diabetes onset. Individual mice are represented by a single symbol, and the horizontal line shows the mean ± SD age at diabetes onset. P < 0.0001 by unpaired t test. C–E: Female mice (6.3–6.9 weeks old) were left untreated (n = 16), mock-vaccinated with vaccine buffer and infected with CVB1 virus (buffer + CVB1; n = 16), or vaccinated with CVB1 vaccine and infected with CVB1 virus (vaccine + CVB1; n = 12). Vaccinations were performed on days 0, 21, and 35, and the mice were infected with virus (107 PFU by i.p. injection; total volume, 200 μL) on day 42 (12.3–12.9 weeks of age). Diabetes incidence was followed up to 30 weeks of age. C: Neutralizing antibody titers on days 0 and 42 in mice vaccinated with the CVB1 vaccine as measured by standard plaque reduction assay. Neutralizing antibodies were not detected in the mock-vaccinated and untreated groups (data not shown). Individual mice are represented by a single symbol, and the horizontal line shows the mean ± SD neutralizing antibody titer. P < 0.005 by unpaired t test. D: Diabetes incidence curves in the untreated, buffer + CVB1, and vaccine + CVB1 groups. The black arrows indicate the approximate vaccination ages, and the red arrow indicates the approximate age when the mice were infected. The gray box shows the 2-week period after virus infection. P = 0.008 when comparing the diabetes incidence curves by the Gehan-Breslow-Wilcoxon test. E: Age at diabetes onset. Individual mice are represented by a single symbol, and the horizontal line shows the mean ± SD age at diabetes onset. Groups were compared by the Kruskal-Wallis test with the Dunn test for multiple comparisons. In brackets are the P values generated when one mouse, which was borderline diabetic from 15 weeks of age but did not develop overt diabetes until 25 weeks of age, was excluded (open square; buffer + CVB1). See Supplementary Fig. 3B for the blood glucose values. F: Representative images of sequential pancreas sections stained with insulin and glucagon from mice that developed diabetes in the untreated, mock-vaccinated (buffer) + CVB1, and vaccine + CVB1 groups. Positive areas are stained brown. Scale bars are present in the bottom left-hand corner of each image. Scale bar = 100 μm.

