Figure 1.
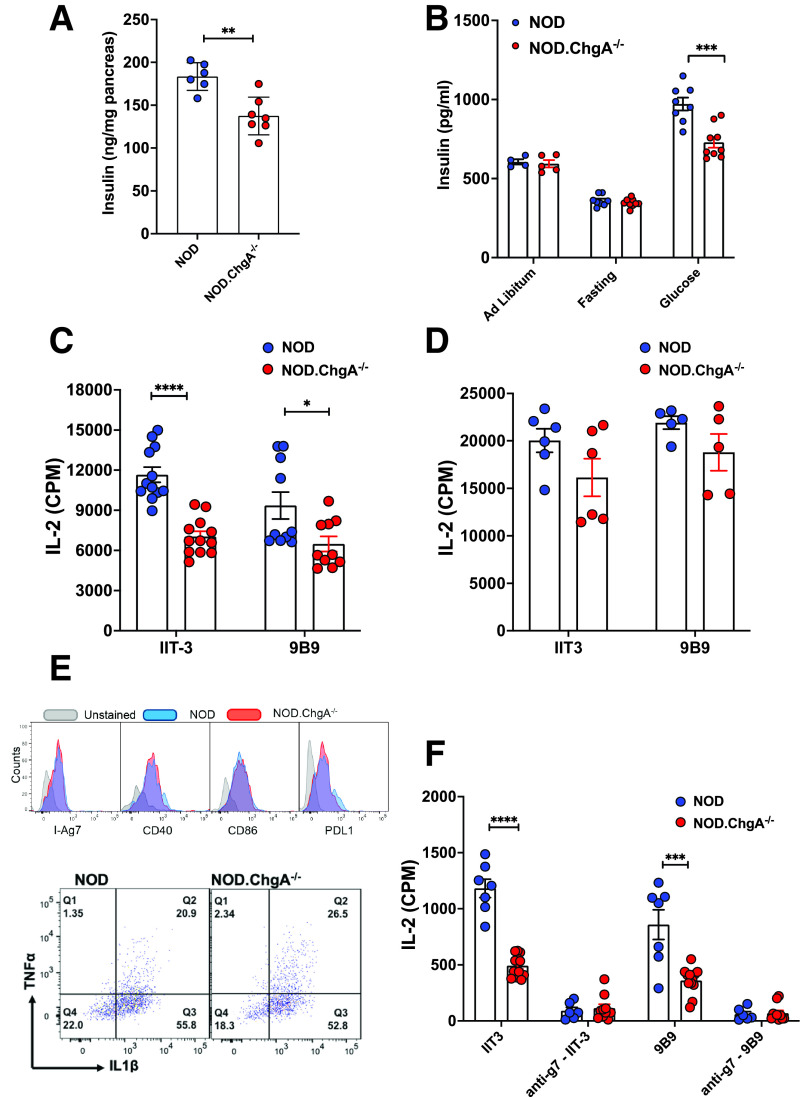
NOD.ChgA−/− mice display impaired insulin presentation. A: Pancreatic insulin content in 5-week-old NOD or NOD.ChgA−/− mice assessed by ELISA. Data (mean ± SEM) summarize results from three independent experiments. Each dot represents individual mouse. B: ELISA analysis of serum insulin levels in NOD or NOD.ChgA−/− mice under indicated conditions. Data (mean ± SEM) are representative of two independent experiments. Each dot represents individual mouse. C: Islet cells from 4- to 6-week-old male NOD or NOD.ChgA−/− mice are evaluated for their spontaneous presentation to two different CD4 T-cell hybridomas (IIT3 and 9B9). Islet cells (5 × 10⁴) were cultured with the IIT3 or 9B9 T cells (5 × 10⁴) without pulse with exogenous antigens. The T-cell responses were probed by measuring IL-2 production in the culture supernatants. Data (mean ± SEM) summarize results from 2–4 independent experiments. Each dot represents a biological replicate of islet cells pooled from 2–3 mice. D: Presentation to the IIT-3 and 9B9 T cells by islet cells from NOD or NOD.ChgA−/− mice pulsed with 10 μmol/L InsB:9–23 peptide. Data (mean ± SEM) summarize results from three independent experiments. Each dot represents a biological replicate of islet cells pooled from 2–3 mice. E: Flow cytometry analysis of I-Ag7, CD40, CD86, and PD-1 ligand (PD-L1) expression, as well as TNF-α and IL-1β production by islet macrophages (gated on live CD45+F4/80+CD11c+) from 5-week-old male NOD or NOD.ChgA−/− mice. Data are representative of two independent experiments. F: Spontaneous presentation of insulin peptides to IIT3 and 9B9 CD4 T-cell hybridomas by blood leukocytes isolated from NOD or NOD.ChgA−/− mice after glucose challenge. Data (mean ± SEM) summarize results from three independent experiments. Each dot represents a biological replicate of blood leukocytes from 1–3 mice. A–F: P values were calculated by unpaired two-tailed Student t test. *P < 0.05, **P < 0.01, ***P < 0.001, ****P < 0.0001. CPM, counts per minute.

