
FIGURE 5.
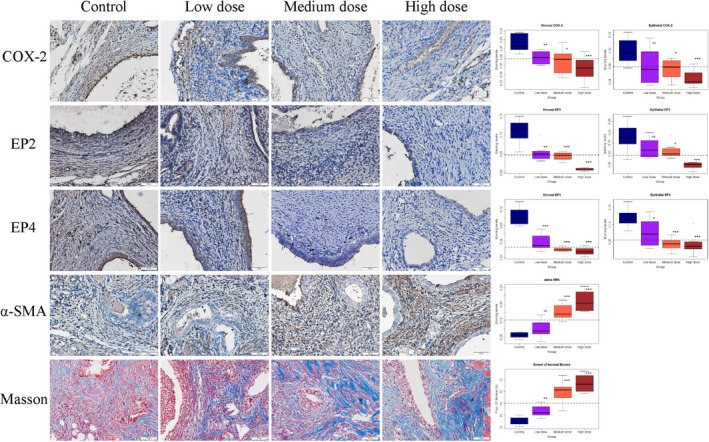
Representative photomicrographs of immunostaining and histochemistry analysis (left panel), along with data summary (right panel). On the left panel, different rows show different markers as indicated. Different columns represent different tissue samples from endometriotic lesions taken from control mice, and mice treated with low‐, medium‐, and high dose of EP2 and EP4 inhibitors (see text for more details), respectively. All mice were induced with deep endometriosis. In Masson trichrome staining, the collagen fibers in lesions were stained in blue. In all figures, magnification: ×400. Scale bar = 50 μm. On the right panel, the results are summarized by the boxplot, separated by the stromal or epithelial component, when applicable. The dashed line represents the median value of all mice. All comparison was made in reference to the control group, and Wilcoxon's test was used. Symbols of statistical significance levels: *P < 0.05; **P < 0.01; ***P < 0.001; NS: not statistically significant (P > 0.05)