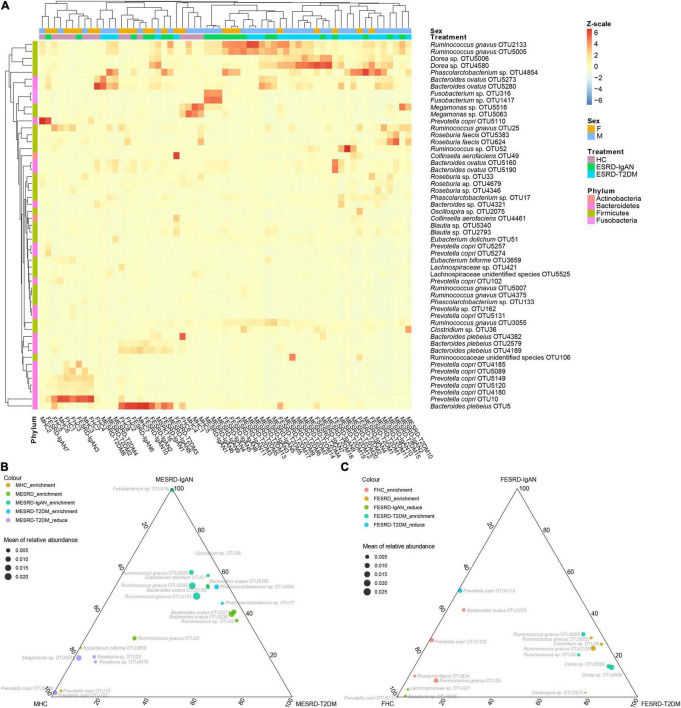
FIGURE 3.
(A) Heatmap and (B,C) ternary diagram profiles showing the dominant OTU differences in fecal microbiota of male and female healthy controls and patients with end-stage renal disease caused by IgA nephropathy (ESRD-IgAN) or type-2 diabetes mellitus (ESRD-T2DM). FHC, FESRD-IgAN, and FESRD-T2DM indicate female healthy control and patients with end-stage renal disease caused by IgA nephropathy (ESRD-IgAN) or type-2 diabetes mellitus (ESRD-T2DM), respectively. MHC, MESRD-IgAN, and MESRD-T2DM indicate male healthy control and patients with ESRD-IgAN, or ESRD-T2DM, respectively.

