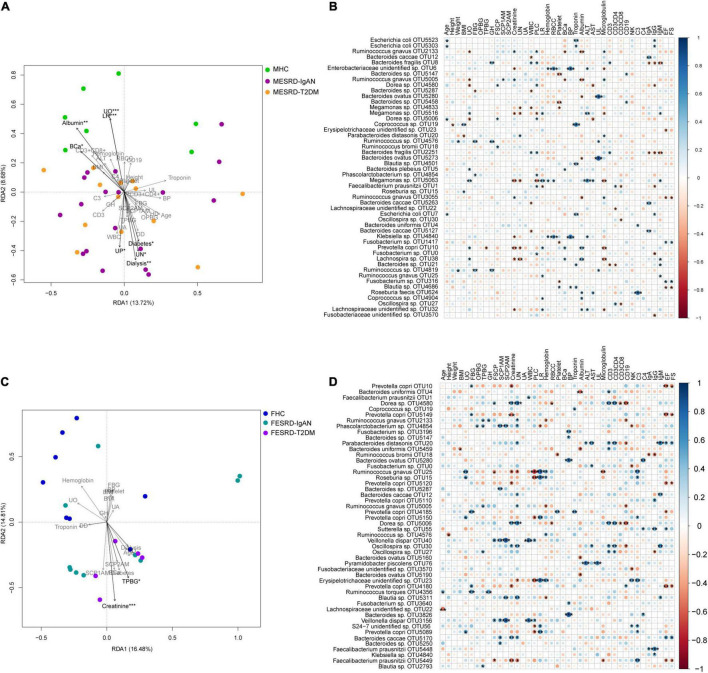
FIGURE 4.
Correlation between physical, blood, and urine indices of volunteers and their fecal microbiota compositions. (A,C) Tb-RDA profile showing the correlation between physical, blood, and urine indices of male and female volunteers and their fecal microbiota OTU compositions. (B,D) Bubble charts showing the Pearson correlation between physical, blood, and urine indices of male and female volunteers and the top 50 dominant OTUs in their fecal microbiota. FBG, fasting blood glucose; OPBG, one-hour post-prandial blood glucose; TPBG, two hours post-prandial blood glucose; FSCP, fasting serum C-peptide; SCPO, serum C-peptide one hour after meal; SCPT, serum C-peptide two hours after meal; RBCC, red blood cell count. *, p < 0.05; **, p < 0.01; ***, p < 0.001.

