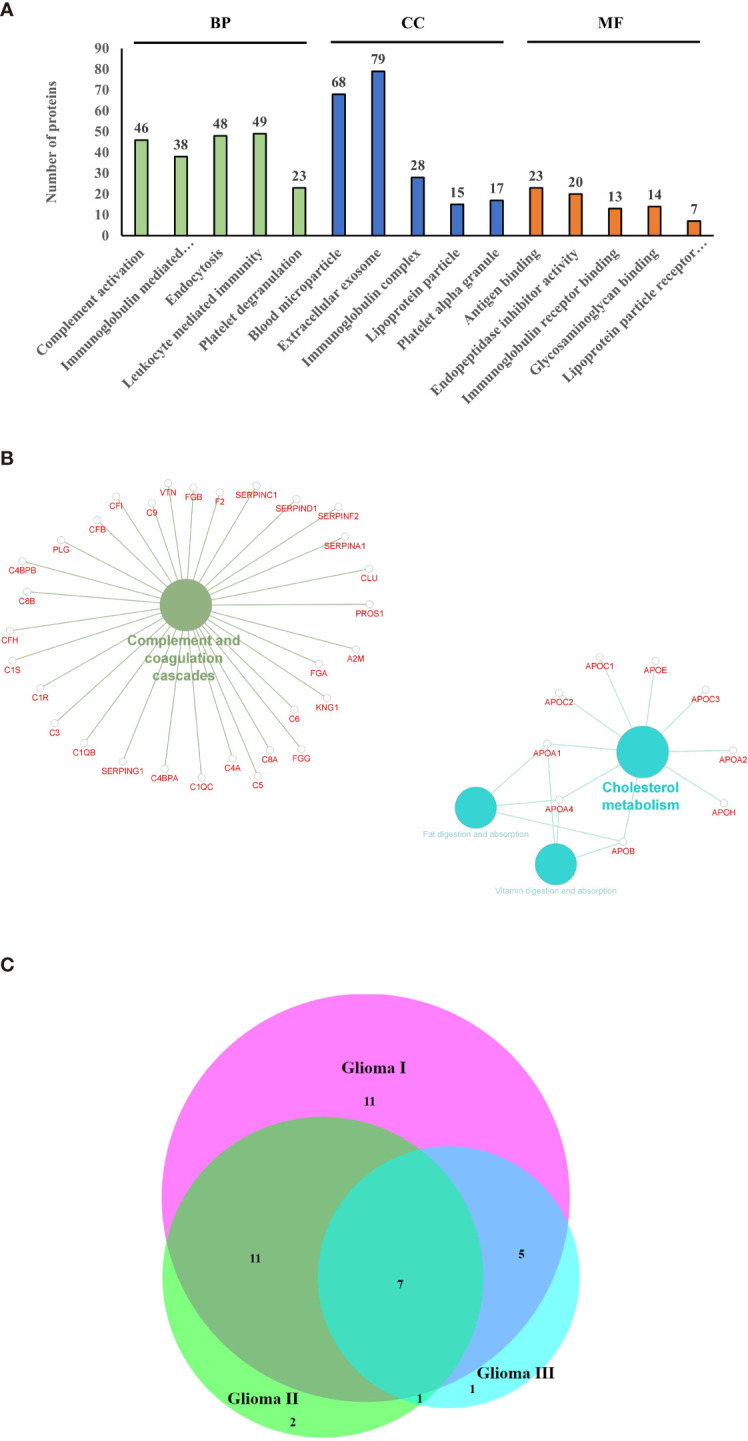
Figure 3.

Gene ontology and pathway analysis. (A) Gene ontology terms that were found to be enriched after functional annotation of identified protein using g-profiler and the number of proteins under each category (BP, Biological Process; CC, Cellular Component; MF, Molecular Function). (B) Pathways that were found to be enriched among the identified proteins. (C) Venn diagram indicating the common differentially expressed proteins between the grades.
