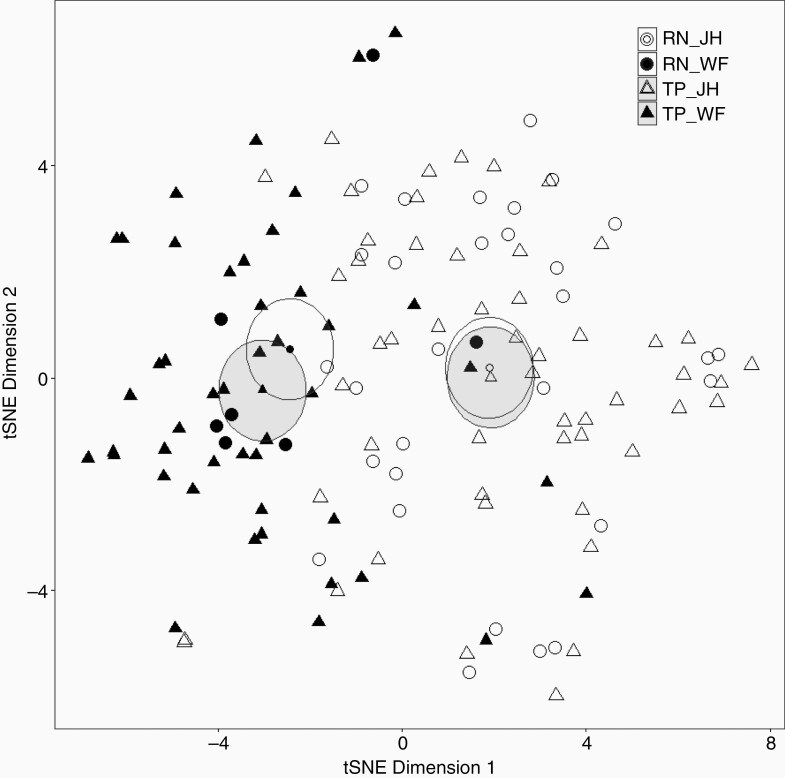
Figure 2.
T-distributed stochastic neighbor embedding (tSNE) analysis showing separation of cases from the 2 institutions. The high-dimensional radiomic feature space containing 139 single and multiparametric features and 135 cases is represented in 2-dimensional space with arbitrary axes using the tSNE. Individual cases are represented by circles (radiation necrosis, RN, N = 37) and triangles (tumor progression, TP, N = 98). Institutional origins are represented by open (Johns Hopkins cases, JH) or closed (Wake Forest cases, WF) dots. Ellipses (RN, white; TP, gray) represent 95% confidence intervals of group means (smaller dots in the center of the ellipses).

