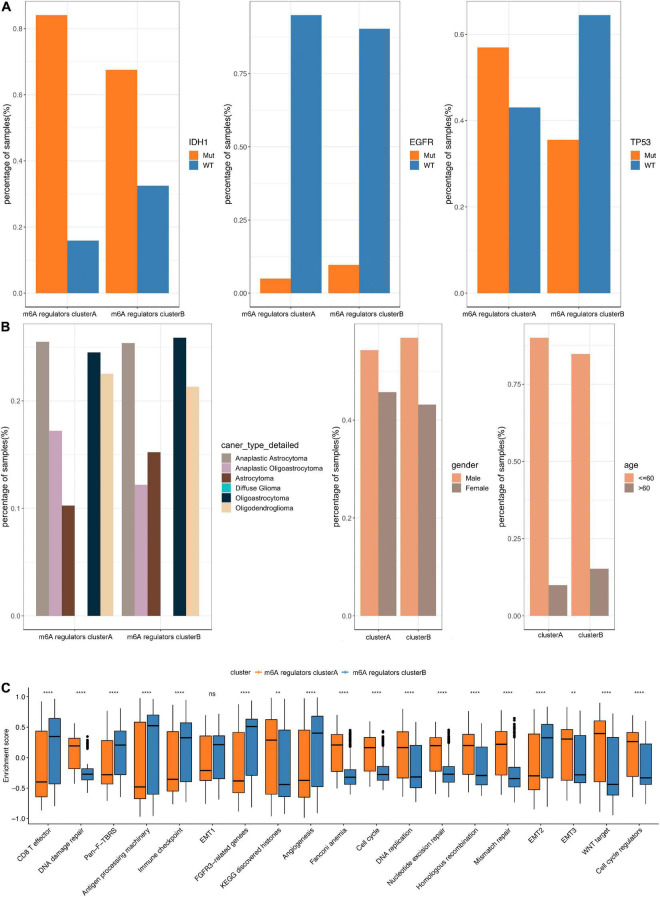
FIGURE 3.
Comparative analysis between m6A 4 regulators cluster in the TCGA dataset. (A) The distribution of IDH1, EGFR, TP53 mutations in the 2 m6A regulators clusters. (B) The distribution of cancer type, gender, and age in m6A regulators cluster. (C) The enrichment scores of different m6A regulators cluster groups difference (**p < 0.05, ****p < 0.001).

