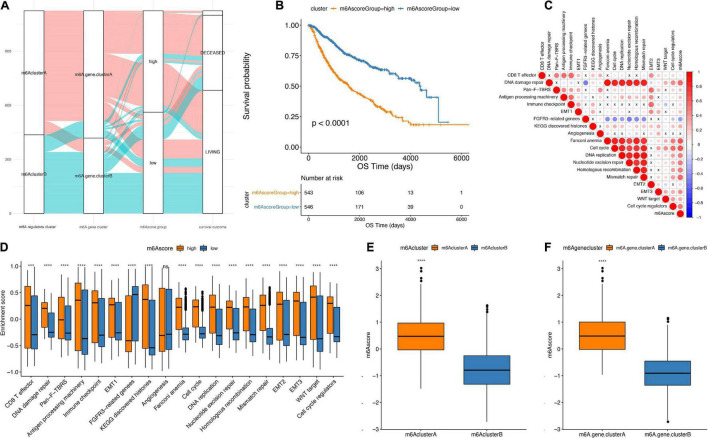
FIGURE 6.
Establishment of m6Ascore. (A) Alluvial plot showing the changes of m6A cluster, gene cluster and m6Ascore. (B) Kaplan-Meier curve shows that m6Ascore high and low grouping has a significant relationship with overall survival rate. (C) Using Pearson analysis, the correlation between m6Ascore and known gene features in low-grade gliomas. Negative correlation is marked in blue, and it is positively correlated with red. X in the figure indicates that the correlation is not significant, and the larger the circle, the more significant. (D) The distribution of the enrichment scores of known gene features in the m6Ascore high and low group samples in the TCGA+CGGA data set (***p < 0.01, ****p < 0.001). (E) The distribution of m6Ascore in m6A regulators cluster (****p < 0.001). (F) Distribution of m6Ascore in m6Agenecluster (****p < 0.001).

