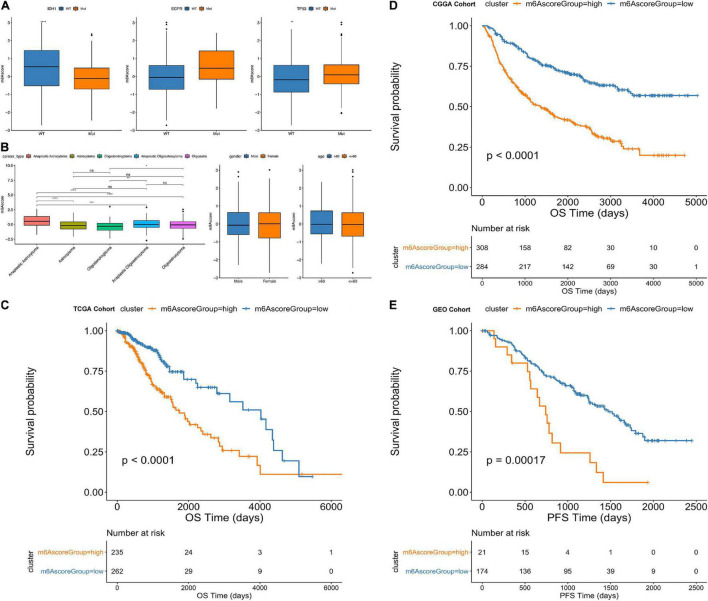
FIGURE 7.
Comparative analysis and model verification of m6Ascore in TCGA dataset. (A–D) Distribution of m6Ascore in different classification subgroups. (A) IDH1, EGFR, TP53. (B) Cancer type. (C) Gender. (D) Age. (E) Difference in survival between m6Ascore high and low groups in the TCGA samples. (p < 0.0001).

