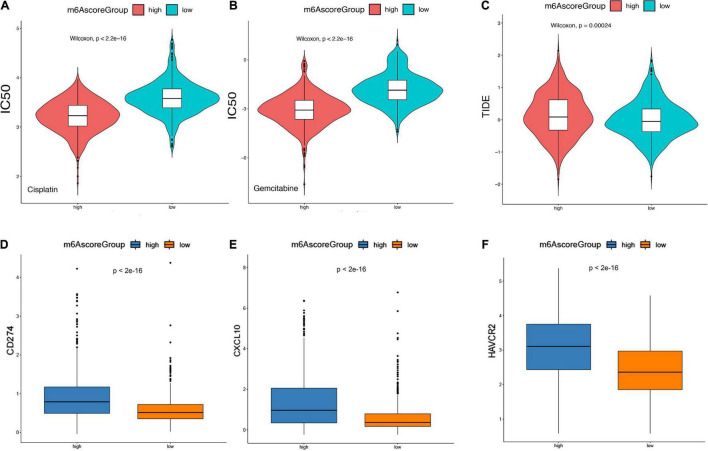
FIGURE 9.
m6Ascore provided predictive outcomes for LGG patients receiving immunotherapies. (A,B) The difference between the IC50 values of Cisplatin and Gemcitabine in the samples of the high-risk group and the low-risk group. (C) The difference of TIDE score between samples of high-risk group and low-risk group. (D–F) Analysis of the degree of correlation between the TIDE score in multiple cohorts and the differential expression of immune checkpoint molecules. (D) CD274, (E) CXCL10, (F) HAVCR2.

