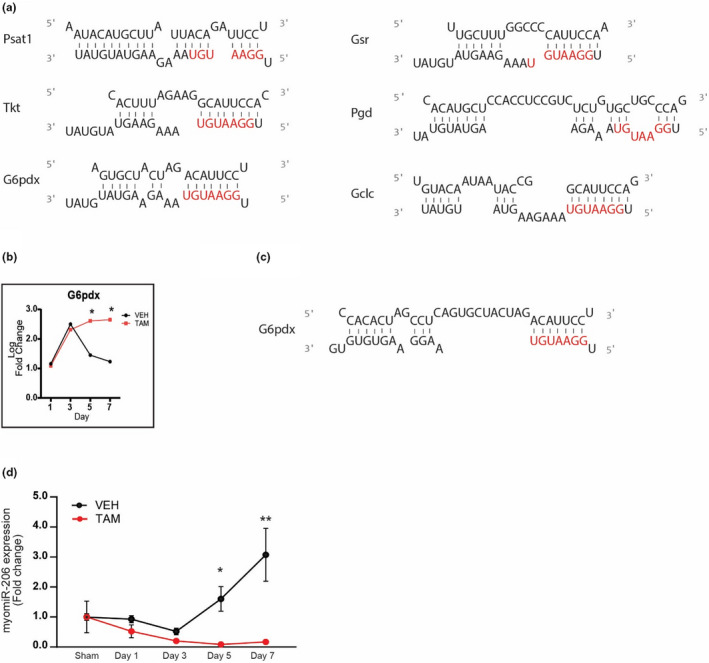
FIGURE 5.

Skeletal muscle metabolism regulated by a myomiR‐1 network. (a) In‐silico prediction of myomiR‐1 metabolic target genes 3’ UTR seed sequence and miyomiR‐1 (b) Expression of G6pdx in SC+ and SC‐ skeletal muscle throughout the time course (c) G6pdx 3'‐UTR seed sequence and myomiR‐206 (d) myomiR expression throughout the time course. Log twofold change of DEGs between Vehicle‐ and Tamoxifen‐treated mice after mechanical overload. N = 2/group (pooled samples) for (a‐c), and n = 6 for (d). *denotes statistical significance (p value <0.05) between vehicle‐ and tamoxifen‐treated mice
