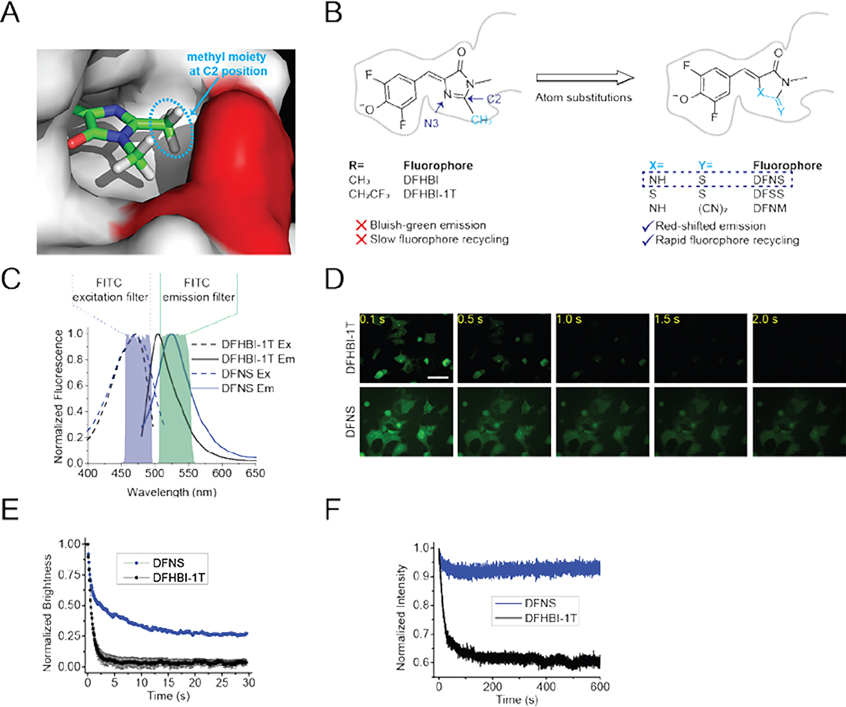
Figure 1. Identification of DFNS, a novel fluorophore with markedly increased recycling in Broccoli-expressing mammalian cells.
(A) The methyl moiety (indicated in a light blue dotted ellipse) at the C2 position of DFHBI binds in a relatively narrow groove in the RNA. Shown is the orientation of DFHBI in Spinach/Broccoli RNA based on the cystal structure.[2] The methyl group on the C2 position closely abuts the A44 in Spinach (red). (B) Chemical structure of Broccoli-binding fluorophres, including DFHBI and DFHBI-1T as well as the fluorophores with atomic substitutions. To avoid having a methyl moiety (blue) at the C2 position, we synthesized three new fluorophores with less bulky substituents: DFNS, DFSS, DFNM. Compared to DFHBI-1T, DFNS exhibits the most red-shifted spectra (Figure 1C). DFNS also shows increased photostability, which reflects enhanced fluorophore recycling (see Figure 1D and 1E). (C) Fluorescence spectra of Broccoli-DFNS. Excitation (Ex, dotted line) and emission (Em, solid line) spectra were measured using 10 μM Broccoli and 0.5 μM DFNS or DFHBI-1T in buffer containing 40 mM HEPES pH 7.4, 100 mM KCl and 1 mM MgCl2. Shown are the excitation and emission filters for the common FITC filter cubes. (D) and (E) DFNS shows improved fluorophore recycling in living cells compared to DFHBI-1T. In vivo photostability of Broccoli-flurophore complexes (final concentration of 10 μM for each fluorophore in the cuture media) was assessed by continuous imaging of HEK293 cells expressing circular Broccoli. Images were acquired (100 ms/frame) using a 40× objective with a FITC filter cube. Scale bar, 50 μm. (E) Quantification of Broccoli-fluorophore photostability in HEK293 cells. The average brightness of Broccoli-expressing cells incubated with 10 μM DFHBI-1T or was DFNS was measured (n = 3 cells per measurement). DFHBI-1T and DFNS show a similar initial drop in fluorescence (between 0–0.5 sec). However, DFNS shows a higher plateau, indicating improved fluorophore recycling compared to DFHBI-1T. (F) Broccoli-DFNS exhibits higher photostability compared to Broccoli–DFHBI-1T in vitro. Fluorescence was measured in a solution containing 0.1 μM DFNS or DFHBI-1T and 1 μM Broccoli. The plot for DFHBI-1T is taken from ref. 3

