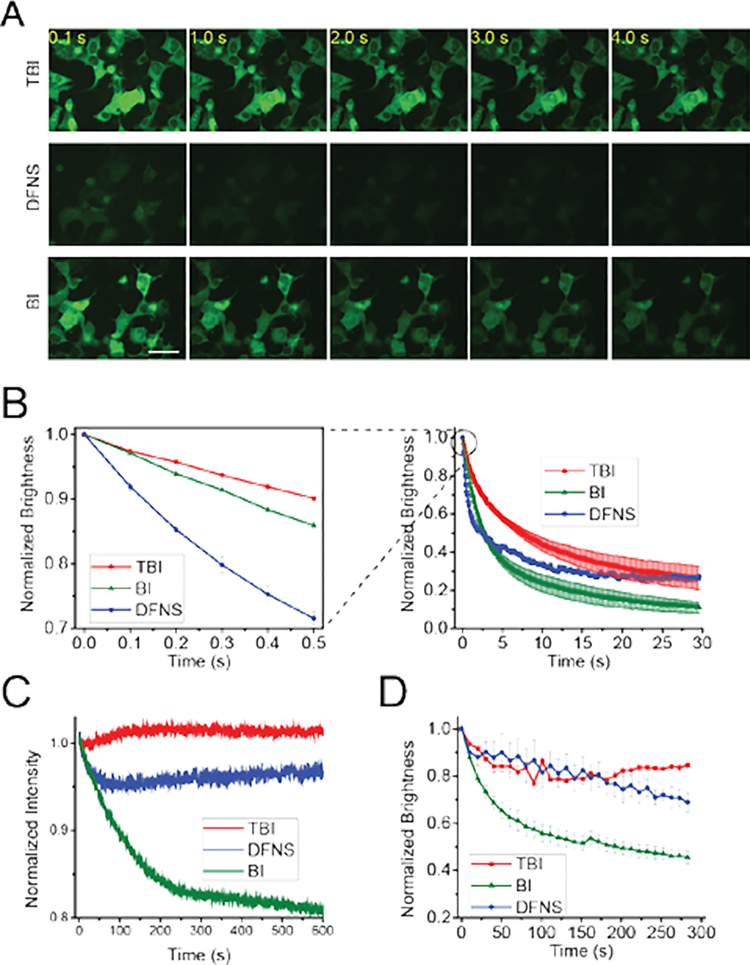
Figure 4. Broccoli-TBI exhibits high photostability and high fluorophore recycling rate.
(A) and (B) TBI exhibits markedly improved photostability and a higher recycling rate compared to DFNS and BI in living cells. In vivo photostability of Broccoli-fluorophores (10 μM) was assessed by continuous imaging of cells expressing circular Broccoli at an exposure time of 100 ms for each frame. Images were acquired using a 40× objective with a FITC filter cube for Broccoli fluorescence. Scale bar, 50 μm. (B) Quantification of cellular fluorescence in panel (A). On the right is a time course over 30 s. The panel on the left shows the first 0.5 s in order to more easily detect the initial rate of fluorescence loss, which reflects the photoisomerization rate. As can be seen, TBI shows the least photoisomerization, and this rate is substantially improved relative to DFNS. To determine the fluorophore recycling rate, we examined the fluorescence plateau. As can be seen, both TBI and DFNS exhibit a higher plateau compared to BI. Error bars indicate s.e.m. for n=3 cells per condition. Scale bar, 50 μm. (C) Broccoli-TBI exhibits high photostability in vitro. In these cuvette experiments measured in a fluorometer, we used solutions containing 0.1 μM fluorophore (TBI, DFNS, BI) and 1 μM Broccoli. (D) TBI exhibits a higher rebinding relative to BI. To determine the degree of rebinding, we examed the fluorescence recovery rate in vivo. In vivo brightness of Broccoli-flurophores (10 μM) was measured every 10 s. Broccoli-expressing cells incubated with BI exhibited a drop in cellular fluorescence using this commonly used imaging protocol. However, cells incubated with TBI or DFNS exhibited a significantly smaller reduction in cellular fluorescence. Images were acquired with a FITC filter cube for Broccoli fluorescence. Error bars indicate s.e.m. for n=3 cells per condition. The plot for BI is taken from ref. 3.

